What Is a Property Data Report? What's Inside, Sample, and How to Get One
"Property data report" is two different things wearing the same name, and the search results don't tell you which one you've found. To a title company or a data vendor it's a compiled record of one parcel: who owns it, what it sold for, what it's taxed at, what's owed on it. To a mortgage lender it's a specific document defined by Fannie Mae and Freddie Mac, filled in by a trained collector who walks through the house so an appraiser doesn't have to. Ask for one when you meant the other and you'll either get a four-dollar PDF or a confused underwriter.
This guide is the plain-language version. It defines both meanings, walks through what's actually inside a property data report section by section (with where each section's data comes from, which is the part that matters), shows you what a sample looks like, compares free and paid ways to get one with prices read from the vendors' own pages on August 22, 2026, and ends with a script that assembles one from an API. If you're a developer who already knows all that and wants the schema and provenance design, our developer's guide to property data reports is the companion piece; this one is for everyone who had to look the phrase up.
The plain definition
A property data report is a document that gathers everything on record about a single property into one place. The "on record" part is the definition: the report doesn't invent anything, it collects what a county recorder, a tax assessor, a permit office, a listing service, and a valuation model have each separately written down about the same address, and lines them up so a person can read them in ten minutes instead of a week. Buyers order one before an offer, investors before an underwriting, lenders before a loan, and title companies before a closing. In the UK the nearest equivalent is the Land Registry title register; in Australia it's a Cotality (formerly CoreLogic) RP Data property report.
The thing most explanations skip: a property data report is only as good as its worst section. The ownership record might be current to last week. The assessed value might be two years old by design. The "estimated value" might be a model that has never seen the inside of the house. A report presents them side by side with equal typographic confidence, and the reader's job is to know which sections to trust for what. That's what the rest of this post is for.
The other meaning: the lender's PDR
If you arrived here from a mortgage context, "Property Data Report" (usually capitalized, usually abbreviated PDR) means something narrower. Freddie Mac describes it as the product of property data collection, "completed by trained property data collectors," used to inform alternative collateral valuation options, and is explicit that it's not an appraisal and doesn't involve an opinion of value. Fannie Mae's equivalent is the value acceptance + property data option, which requires interior and exterior data collection, photos, and a floor plan to the ANSI standard, submitted through Fannie's Property Data API, after which "an appraisal is not required." Freddie publishes an un-gated sample PDR, and it looks nothing like a vendor property report: room-by-room floors, walls, condition, and photo placeholders; kitchen appliances; heating and cooling; foundation, roof age, windows, utilities. It's a condition inventory, not a records search. The two documents share a name and almost nothing else.
What's inside a property data report
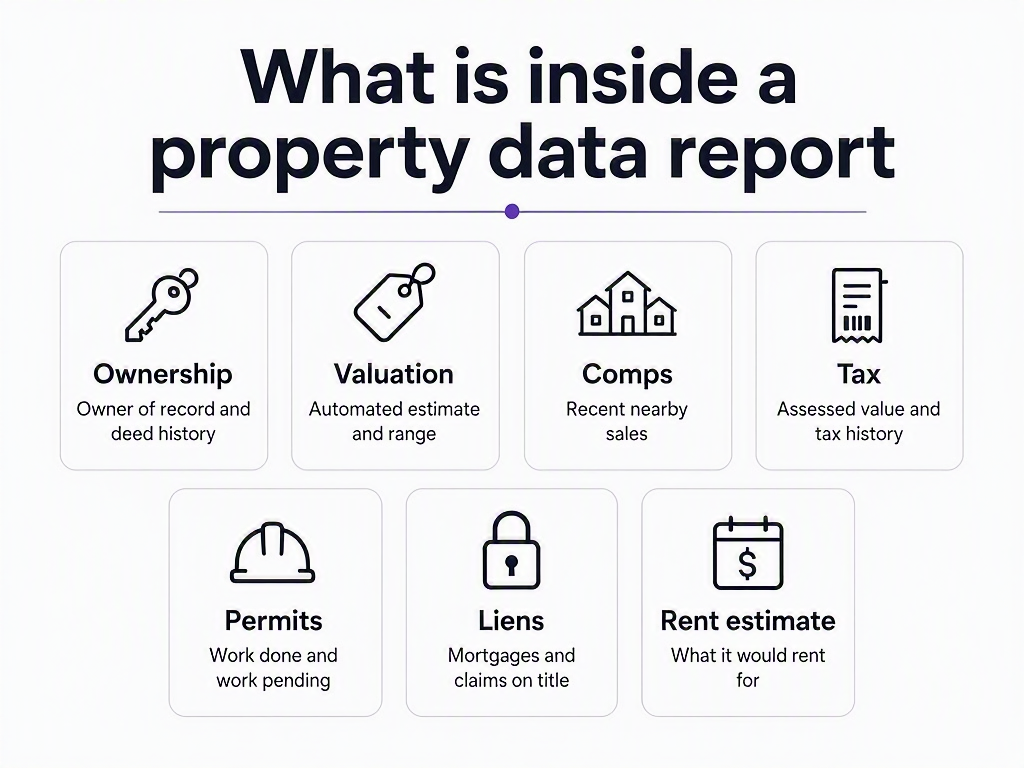
Vendors slice it differently (First American's Property Detail Report uses five headings, PropertyShark's uses eight), but the same seven kinds of information show up in nearly every report. For each, here's what it contains, where it actually comes from, and how fresh it tends to be.
| Section | What it contains | Where the data really comes from | How stale it can be |
|---|---|---|---|
| Ownership | Owner of record, vesting (individual, trust, LLC), mailing address, occupancy, and the chain of deeds with dates, prices, grantors, and grantees | The county recorder's deed filings (NYC's ACRIS, for instance, covers recorded documents from 1966 to the present for four boroughs) | Current to the last recording, typically days to weeks behind a closing |
| Property characteristics | Living area, beds and baths, year built, lot size, stories, construction, zoning, legal description, parcel number | The assessor's records, occasionally corrected by listing data | Years; assessors don't re-measure until a permit or a sale triggers it |
| Valuation | An automated valuation model (AVM) estimate, sometimes with a range or confidence score | A statistical model. Fannie Mae's glossary defines AVMs as "statistically based computer programs that use real estate information, such as comparable sales, property characteristics, tax assessments, and price trends, to provide an estimate of value" | Fresh (models rerun often) but blind: no one has seen the interior |
| Comparables | Recent nearby sales of similar homes: address, sale date, price, size, distance | Recorder data and MLS sold records. Fannie Mae's appraisal rules ask for at least three closed comps, preferably within the last 12 months, with similar physical and legal characteristics | As fresh as the source; sold records lag closings by days to weeks |
| Tax and assessment | Assessed land and building values, tax class, exemptions, annual tax amount, and an assessment history | The county assessor and treasurer; the same portals you can search yourself (Los Angeles, Harris County, Maricopa all run public lookups) | Annual cycle; assessed value is often deliberately below market |
| Permits | Building permits issued and pending: additions, roofs, electrical, demolitions | City building departments; big cities publish open data (Chicago's permit dataset runs from 2006 and updates daily) | Good where the city publishes; absent in many smaller jurisdictions |
| Liens and mortgages | Open mortgages with lender and original amount, releases, tax liens, HOA liens, foreclosure and pre-foreclosure filings | Recorder filings again, plus court records for involuntary liens | Recording-dependent; a "no liens" result is only as complete as the indexes searched |
| Rent estimate | What the property would rent for, sometimes with a range | A model over listing data; for a public benchmark, HUD publishes Fair Market Rents at the 40th percentile of gross rents by area | Fresh but modeled; check it against live rental listings |
| Hazards and context | Flood zone, climate risk, school assignments and ratings, walkability, neighborhood stats | FEMA's Flood Map Service Center for flood zones; First Street Foundation and similar for climate; GreatSchools for ratings; Census ACS for demographics | Flood maps change rarely; school ratings annually |
Two sections deserve a warning label. First, an AVM is not an appraisal, and the regulators say so in writing. The federal Interagency Appraisal and Evaluation Guidelines state that the result of an AVM, by itself or signed by an appraiser, is not an appraisal, and a 2024 interagency rule now requires lenders to put quality controls around the models they use. The number is useful for a first filter and dangerous as a last word; our guide to property valuation methods covers how the three approaches differ. Second, the liens section is where "I'll just check it myself" goes wrong. A lien search is an index search, and indexes have gaps, name variants, and documents recorded against the wrong parcel. That's why title insurance exists. This short explainer from a real estate attorney covers what a title search actually involves:

What a sample looks like
The cheapest real example is First American's Property Detail Report, the classic title-company "property profile." It sells for $4.00 a la carte and organizes itself into five blocks: Owner and Vesting Information (names, mailing address, occupancy, transfers, vesting); Property Characteristics (living area, beds and baths, year built, lot, improvements); Sales and Transfer History (last market sale, price history, conveyance details, mortgage recording info); Tax and Assessment Information (assessed values, tax amounts, parcel and tax IDs, assessment history); and Location and Site Details (legal description, APN, neighborhood, nearby schools, zoning). First American's store also links un-gated sample PDFs for that report and its TotalView, Sales Comparables, and AVM reports, which are worth five minutes if you've never held one.
Here's the same structure as a developer would want it, which is also the shape the script at the end of this post produces. Values are placeholders; the point is the sections and the provenance field on each, because a report without sources is a rumor with a logo:
{
  "subject": { "address": "123 Example St, Springfield, ST 00000", "parcel": "000-000-000", "asOf": "2026-08-22" },
  "ownership":   { "source": "county recorder", "ownerOfRecord": "…", "vesting": "…", "deeds": [ { "date": "…", "price": 0, "grantor": "…", "grantee": "…" } ] },
  "characteristics": { "source": "county assessor", "beds": 3, "baths": 2, "sqft": 1710, "yearBuilt": 1962, "lotSqft": 6000, "zoning": "R1" },
  "valuation":   { "source": "AVM", "estimate": 0, "low": 0, "high": 0, "note": "model estimate; not an appraisal" },
  "comps":       { "source": "sold records", "sales": [ { "address": "…", "soldDate": "…", "price": 0, "sqft": 0, "distanceMi": 0.3 } ] },
  "tax":         { "source": "county assessor", "assessedLand": 0, "assessedImprovements": 0, "annualTax": 0, "exemptions": [] },
  "permits":     { "source": "city building dept", "items": [ { "issued": "…", "type": "…", "status": "…" } ] },
  "liens":       { "source": "county recorder", "openMortgages": [ { "lender": "…", "amount": 0, "recorded": "…" } ], "involuntary": [] },
  "rent":        { "source": "rental model", "estimate": 0, "benchmark": "HUD FMR for the area" },
  "hazards":     { "flood": { "source": "FEMA", "zone": "…" }, "climate": { "source": "First Street", "flood": 0, "fire": 0, "wind": 0, "heat": 0 } }
}
Notice the "asOf" date at the top and a "source" on every section. Two vendors will give you the same address with different square footage, and without provenance you can't tell which one to believe. Ask me how I know.
How to get one: free, paid, or generated
There are three honest routes, and the right one depends on whether you need one report or a thousand.
Route 1: assemble it yourself from public records (free, slow)
Everything in the ownership, tax, permit, and lien sections is public in the US, and most of it is online.
Assessor portals for characteristics, assessed value, and tax history: the Los Angeles County Assessor Portal (search by address or AIN), the Harris Central Appraisal District for Houston, and the Maricopa County Assessor for Phoenix (1.8 million parcels) are typical. Every county has one; some are excellent and some are a 1998 form with a CAPTCHA.
Recorder portals for deeds and liens: NYC's ACRIS lets you view recorded document images for Manhattan, Queens, the Bronx, and Brooklyn back to 1966. Many counties charge per image.
Permit data where the city publishes it: Chicago's building permits dataset is searchable by address and updated daily.
Hazards and context: FEMA's Flood Map Service Center is the official source for flood zones; HUD Fair Market Rents give a public rent benchmark with a free API; the Census ACS covers ownership rates, incomes, and demographics.
Budget an hour or two per property, more if the county's recorder isn't online. For one house you're buying, that hour is well spent. For a portfolio it isn't, and that's what the other two routes are for. In England and Wales, the whole of route 1 collapses into one £7 title register from HM Land Registry, which tells you who owns it, what they paid (where available), rights of way, and whether a mortgage has been discharged.
Route 2: buy one (cheap, fast, one at a time)
Prices below are from each vendor's public pricing page as of August 22, 2026. Several vendors have rebranded or consolidated in the past year, so old articles quote products that no longer exist (CoreLogic's RealQuest page now 404s; its successor is Property Intelligence on Araya under the Cotality name, with no public price).
| Product | What you get | Price | Setup | Limitations |
|---|---|---|---|---|
| First American DataTree, Property Detail Report | Owner and vesting, characteristics, last two market sales, mortgage recordings, tax and assessment, legal and site details | $4.00 per report (TotalView with open and involuntary liens, foreclosure status, HOA, and comps is $22.00; Sales Comparables $9.00; AVM $15.00; subscriptions from $25 a month) | Create an account, pay per report | Public-record sections only; no rent estimate or climate data |
| PropertyShark, Property Report | Ownership with deed history, overview, sales history, tax and assessment, zoning and FAR, mortgages and liens, building characteristics, map tools; comps are a separate tool | One free report per free account; subscriptions with 175, 200, or 250 reports a month (dollar prices aren't on the pages we could load) | Free account for the first one | Deepest in New York and other major markets; "data depth may vary by location" |
| ATTOM Property Navigator | Characteristics, owner names and phones, flood, schools, tax and assessment, sales and mortgage history, zoning, equity analysis, comps, AVM, foreclosure search | $499 a year for one user, 200 reports a month, 7-day free trial | Annual subscription | No monthly plan; professional tool, not a one-off purchase |
| PropStream | Transaction and tax history, foreclosure details, AVM and comps, mortgage balance, liens, MLS status, vacancy, rental estimate | $99 a month (Essentials), $199 (Pro), $699 (Elite); deed and mortgage documents $5 each; 7-day trial | Monthly subscription | Built for investor lead lists; overkill for a single property |
| NeighborWho (consumer) | Listings, foreclosure notices, deed records, ownership history, owner contact info | $1 for a 7-day trial with 50 searches (or $5 with PDFs), then from $44.86 a month | Minutes | Compiled from public sources; explicitly not a consumer reporting agency, so not for tenant or employment screening |
| HM Land Registry (England and Wales) | Title register: owner, price paid where available, rights of way, charges | £7 per register or plan; £11 for official copies | Minutes, online | Ownership and charges only; no valuation, comps, or permits |
| Cotality RP Data (Australia) | Ownership, sales and rental history, IntelliVal AVM estimate, rental estimate, sales and rental CMA, building consent history, digital property reports on higher tiers | Subscriptions from AUD 2,159.88 a year including GST (Lite); Base AUD 2,639.88; Premium AUD 2,999.88 | Annual minimum | Professional subscription; no single-report purchase on the public pages |
The pattern: the public-record sections are cheap because the data is public. Four dollars buys ownership, sales, tax, and mortgage history because a vendor already indexed the county. What costs money is volume (ATTOM, PropStream) and the modeled sections (AVM, rent), which is exactly where a human should apply the most skepticism. Yeah… the expensive number is the least certain one.
Route 3: generate it from an API (for more than a handful)
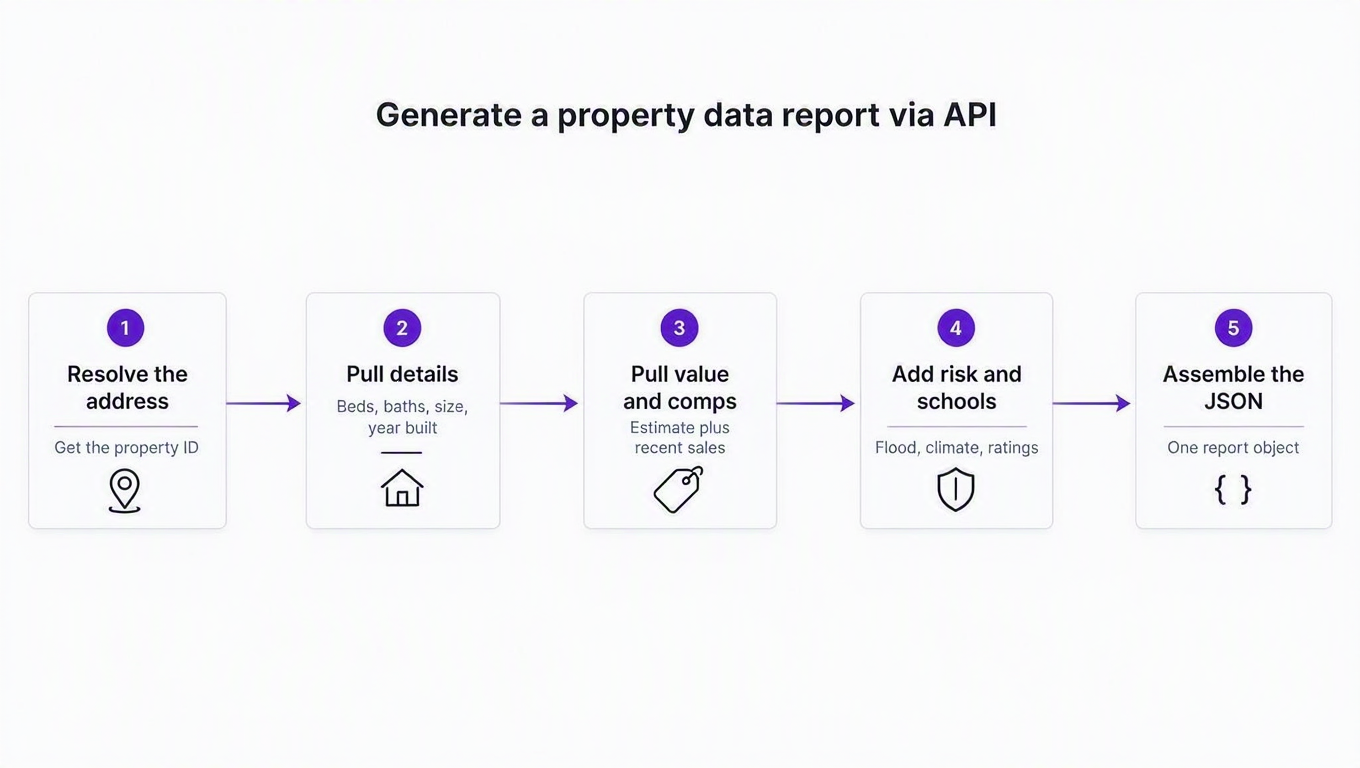
If you need a report per lead, per listing, or per loan file, you want the sections as JSON from endpoints you can call in a loop. Here's the honest scope of what RealtyAPI covers: the characteristics, valuation, comps, rent, market trend, schools, flood, and climate sections, from the listing portals we return data for. The ownership, tax, permit, and lien sections are county-record data, and for those you'll still use route 1 or route 2 (First American's $4 report is the pragmatic choice). We'd rather say that plainly than have you find out from the response.
The script below builds the portal half of the report for one Redfin listing through RealtyAPI, in Node 18+ with no dependencies. It resolves the listing to its IDs with /basicDetails, pulls the AVM, then adds recently sold homes, schools, climate risk, and market trends for the ZIP. Parameter names are the ones in the docs and playground for each endpoint.
// report.js — assemble the portal-sourced sections of a property data report
const API_KEY = process.env.REALTYAPI_KEY;
const BASE = "https://redfin.realtyapi.io";

const LISTING_URL = process.argv[2]; // e.g. https://www.redfin.com/NY/New-York/.../home/12345678
const ZIP = process.argv[3];         // e.g. 10002
if (!LISTING_URL || !ZIP) {
  console.error("usage: node report.js <redfin-listing-url> <zip>");
  process.exit(1);
}

async function get(path, params) {
  const url = new URL(BASE + path);
  for (const [k, v] of Object.entries(params)) url.searchParams.set(k, String(v));
  const res = await fetch(url, {
    headers: { "x-realtyapi-key": API_KEY },
    signal: AbortSignal.timeout(30_000),
  });
  if (res.status === 401) throw new Error("Bad API key (401)");
  if (res.status === 402) throw new Error("Out of credits (402)");
  if (res.status === 429) throw new Error("Rate limited (429); slow down and retry");
  if (!res.ok) throw new Error(`${path} failed: ${res.status}`);
  return { body: await res.json(), credits: res.headers.get("x-credits-remaining") };
}

async function buildReport() {
  // 1. Resolve the listing to its propertyId / listingId.
  const basics = await get("/basicDetails", { property_url: LISTING_URL });
  const propertyId = basics.body.propertyId;
  const listingId = basics.body.listingId;
  if (!propertyId || !listingId) throw new Error("Could not resolve property/listing IDs");

  // 2. Pull the remaining sections. These don't depend on each other, so run them together.
  const [avm, sold, schools, climate, trends] = await Promise.all([
    get("/avm", { property_id: propertyId, listing_id: listingId }),
    get("/recentlySold", { location: ZIP, count: 10 }),
    get("/schools", { location: ZIP }),
    get("/climateRisk", { location: ZIP }),
    get("/housingMarketTrends", { location: ZIP }),
  ]);

  // 3. Assemble, with a source and an as-of date on every section.
  const asOf = new Date().toISOString().slice(0, 10);
  const report = {
    subject: { listingUrl: LISTING_URL, propertyId, listingId, zip: ZIP, asOf },
    characteristics: { source: "redfin:/basicDetails", data: basics.body },
    valuation: { source: "redfin:/avm", note: "model estimate; not an appraisal", data: avm.body },
    comps: { source: "redfin:/recentlySold", data: sold.body },
    schools: { source: "redfin:/schools (GreatSchools ratings)", data: schools.body },
    hazards: { source: "redfin:/climateRisk (First Street)", data: climate.body },
    market: { source: "redfin:/housingMarketTrends", data: trends.body },
    notCovered: ["ownership", "tax", "permits", "liens"], // county records: see routes 1 and 2
  };
  console.error(`credits remaining: ${trends.credits}`);
  return report;
}

buildReport()
  .then((r) => console.log(JSON.stringify(r, null, 2)))
  .catch((e) => { console.error("report failed:", e.message); process.exit(1); });
Run it and you get one JSON object per listing, six requests against your quota (most endpoints are one credit each; the few that cost more are marked in the playground, per the credits docs). The expected shape of the output is the sample above with the data fields filled from each endpoint's response; the credits line prints to stderr so you can pipe the report to a file:
$ REALTYAPI_KEY=rt_... node report.js "https://www.redfin.com/.../home/12345678" 10002 > report.json
credits remaining: 244
Swap the host for realtor.realtyapi.io and the details endpoint for /details/byaddress (which takes a full street address and costs two credits) if you're starting from an address rather than a listing URL. For the comps section at scale, our guide to running a CMA from an API goes deeper on filtering sold records by distance, size, and date, and the rent estimate guide covers the rent section. The free plan's 250 requests a month is about 40 reports with this script, enough to prototype a product before paying for anything.
Our take: read the sources, not the summary
Every vendor's report opens with a headline number, usually the AVM, and most readers stop there. Flip it. Read the report from the sections with a recorder's stamp toward the sections with a model behind them: ownership and deeds first, then tax and assessment, then permits and liens, then comps, and only then the estimate, which you now have enough context to sanity-check. A $4 Property Detail Report read that way is worth more than a $499-a-year subscription read for the headline.
And if you're building a product that generates these, put the source and the as-of date on every section, not just on the cover. It's the one design choice that separates a property data report from a property data guess, and it costs two fields.
Key takeaways
"Property data report" means two things. A compiled public-records profile of a parcel, or the lender's PDR defined by Fannie Mae and Freddie Mac (a condition inventory that replaces an appraisal visit). Know which one you're asking for.
The sections have different sources and different shelf lives. Ownership and liens come from the recorder (days old), tax from the assessor (annual), valuation and rent from models (fresh but unverified). Trust accordingly.
An AVM is not an appraisal. Federal guidelines say so explicitly, and a 2024 interagency rule requires lenders to quality-control the models. Use the estimate as a filter, not a verdict.
Public-record sections are cheap; modeled sections aren't. First American sells ownership, sales, tax, and mortgage history for $4.00; the Land Registry register is £7. Volume and valuation are what cost $99 to $499.
For more than a handful, generate the portal half from an API and buy the county half. Characteristics, AVM, comps, schools, flood, climate, and market trends come from endpoints you can loop; ownership, tax, permits, and liens still come from the county or a $4 report.
If you want to try route 3, point the script above at a listing you know on the free plan (250 requests a month, no card), then buy the $4 county report for the same address and lay them side by side. The differences between the two are the most educational thing you'll read about property data this month.