Running a Comparative Market Analysis With a Real Estate API

Somewhere right now, an analyst is copying sold listings into a spreadsheet, one tab per property, to justify a price their gut already picked. The comparative market analysis is the most manual ritual in residential real estate. It is also one of the easiest to automate: with a real estate API, pulling comps is one request, the adjustment grid is arithmetic, and a defensible value range falls out the other end.
This is a build-it tutorial. By the end you will have pulled a real subject property and its comparable sales through Zillow data on RealtyAPI, screened the comp set, run a CMA adjustment grid in code, and written a tiny AVM that, on the worked example below, lands within 1% of the property's actual sale price. Every response in this post came from a live call made while writing it. Nothing is mocked.
What a Comparative Market Analysis Actually Settles
A CMA answers one question: given what similar homes actually sold for, what should this one trade at? An appraisal answers the same question with a license attached. An AVM answers it a million times a night without explaining itself. All three stand on the same foundation, the sales comparison approach: find recent sales that resemble the subject, adjust their prices for the differences, and read the value off the adjusted results. Investopedia's definition is the standard one if you want the textbook version.
A valuation you cannot explain is a valuation you cannot defend. That is the whole reason the CMA has survived the AVM era. When a seller pushes back on your list price, or an underwriter questions your model output, "the algorithm said so" ends the conversation badly. A CMA is nothing but the paper trail: these sales, these adjustments, this conclusion. Argue with any line you like.
Agents build these by hand in MLS software. If you want to see the manual workflow you are about to automate, this walkthrough of running one in Matrix MLS is a solid tour of the ritual:

Why not just read the Zestimate field and go home? Fair question, and on our example property the Zestimate was genuinely good (you will see the numbers in Step 6). But an estimate field cannot tell you why, cannot be argued with, and degrades silently in thin markets. If your product prices offers, underwrites loans, or advises sellers, you need the evidence, not just the verdict.
Prerequisites
- A RealtyAPI key: the five-minute setup covers it. Requests are authenticated with an
x-realtyapi-keyheader. - Both endpoints used here cost 1 credit per call, so the whole tutorial runs on a handful of credits.
- Node 18+ (for built-in
fetch) or curl. No SDK, no dependencies.
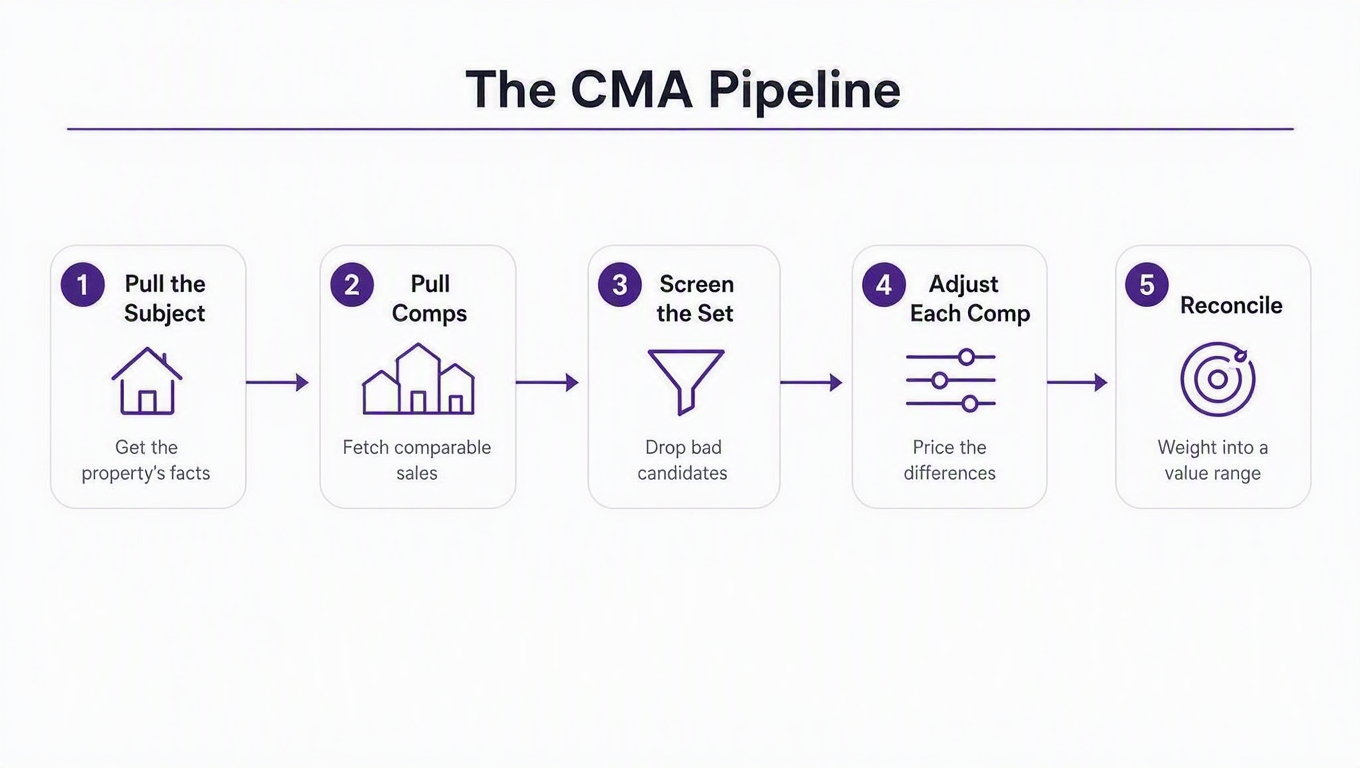
The pipeline has five stages, and each one exists to catch a specific way the previous one lies to you:
Step 1: Pull the Subject Property
Everything in a CMA is relative to the subject, so start by getting its facts straight. The Zillow property endpoint (you can try it in the API playground) resolves a plain-text address to the property record behind it:
curl "https://zillow.realtyapi.io/pro/byaddress?propertyaddress=1221+Victoria+St+APT+301,+Honolulu,+HI+96814" \
  -H "x-realtyapi-key: YOUR_API_KEY"
The full response is a few thousand lines of everything Zillow knows about the property. The fields a CMA cares about, from the actual response:
{
  "message": "200: Success",
  "propertyDetails": {
    "zpid": 82498878,
    "streetAddress": "1221 Victoria St APT 301",
    "city": "Honolulu", "state": "HI", "zipcode": "96814",
    "homeType": "CONDO", "homeStatus": "SOLD",
    "bedrooms": 3, "bathrooms": 3, "livingArea": 1937,
    "yearBuilt": 1980, "lastSoldPrice": 245000,
    "zestimate": 238500, "rentZestimate": 4679,
    "monthlyHoaFee": 2876, "propertyTaxRate": 0.28
  }
}
So: a 1,937 sqft, 3-bed, 3-bath condo in Makiki, built in 1980, last sold for $245,000 in May 2025, with an HOA fee of $2,876 a month. Park that HOA fee somewhere you can see it. It comes back in Step 3 and explains a number that will otherwise look insane.
Step 2: Pull the Comps
The /comparable_homes endpoint takes a zpid, a Zillow URL, or a plain address, and returns the properties Zillow considers comparable. In code, with error handling, saved as comps.mjs:
const BASE = "https://zillow.realtyapi.io";
const KEY = process.env.REALTYAPI_KEY;

async function getComps(address) {
  const url = `${BASE}/comparable_homes?byaddress=${encodeURIComponent(address)}`;
  const res = await fetch(url, { headers: { "x-realtyapi-key": KEY } });
  if (!res.ok) throw new Error(`Comps request failed: ${res.status} ${await res.text()}`);
  const data = await res.json();
  return data.comparable_homes.map(({ property: p }) => ({
    address: p.address.streetAddress,
    building: p.formattedChip.location[0].fullValue, // building name for condos
    price: p.price,
    sqft: p.livingArea,
    beds: p.bedrooms,
    baths: p.bathrooms,
    status: p.homeStatus,
  }));
}

const comps = await getComps("1221 Victoria St APT 301, Honolulu, HI 96814");
console.table(comps);
Output from the live call:
┌─────────┬─────────────────────────────┬───────────────────────┬────────┬──────┬──────┬───────┬─────────────────┐
│ (index) │ address                     │ building              │ price  │ sqft │ beds │ baths │ status          │
├─────────┼─────────────────────────────┼───────────────────────┼────────┼──────┼──────┼───────┼─────────────────┤
│ 0       │ '1221 Victoria St APT 1101' │ 'Admiral Thomas Apts' │ 185000 │ 1692 │ 2    │ 2     │ 'RECENTLY_SOLD' │
│ 1       │ '1400 Pensacola St APT 505' │ 'Barclay'             │ 399000 │ 991  │ 2    │ 2     │ 'RECENTLY_SOLD' │
│ 2       │ '1221 Victoria St APT 1205' │ 'Admiral Thomas Apts' │ 238000 │ 1634 │ 2    │ 2     │ 'RECENTLY_SOLD' │
└─────────┴─────────────────────────────┴───────────────────────┴────────┴──────┴──────┴───────┴─────────────────┘
Two closed sales in the subject's own building and one from a building a few blocks over. One important mental adjustment before you touch this data: treat an API's comps as a candidate pool, not a finished comp set. Zillow chose these using its own similarity criteria, which you do not control. Selecting which candidates deserve to be evidence is your job, and it is the next step.
Step 3: Screen the Comp Set Before You Trust It
Compute price per square foot on the candidates and the problem introduces itself:
| Comp | Building | Sold | Sqft | $/sqft |
|---|---|---|---|---|
| 1221 Victoria St APT 1101 | Admiral Thomas Apts | $185,000 | 1,692 | $109 |
| 1400 Pensacola St APT 505 | Barclay | $399,000 | 991 | $403 |
| 1221 Victoria St APT 1205 | Admiral Thomas Apts | $238,000 | 1,634 | $146 |
Why is one comp $403 per square foot when units in the subject's building trade at $109 to $146? Remember the subject's monthlyHoaFee: 2876. A carrying cost of $2,876 a month gets capitalized straight into what buyers will pay, and the subject's building-mates share that cost structure. The smaller unit in the other building almost certainly does not carry it. There are other usual suspects for a spread like this (land tenure matters a lot in Honolulu, and condition and floor level matter everywhere), and the right move is the same either way: pull the outlier's own property record and find out, or drop it. What you may not do is average it in and call the result a valuation.
Averaging an unscreened comp set does not dilute the bad comp; it institutionalizes it. On this exact data, keeping the Barclay unit in the set moves the final estimate from $246,499 to $394,320. That is a 61% error, produced by one comp, and no later stage of the pipeline can un-bake it.
A screening pass that would have caught it, and catches most bad candidates:
- Same property type and tenure. Condo to condo, and in markets with leasehold property, matching lease terms. Cost structures (like that HOA fee) should match too.
- Living area within roughly ±20% of the subject. The 991 sqft unit against a 1,937 sqft subject fails instantly.
- Closed sales only.
homeStatus: "RECENTLY_SOLD"is evidence. An active listing is an asking price, which is an opinion. - Recent and nearby. The tighter the market moves, the shorter your lookback window should be. Same building beats same block beats same ZIP.
- Investigate outliers instead of silently deleting them. Sometimes the outlier is the story (a renovation wave, a lease renegotiation). Deleting it without looking is how you miss the story.
Step 4: Run the Adjustment Grid
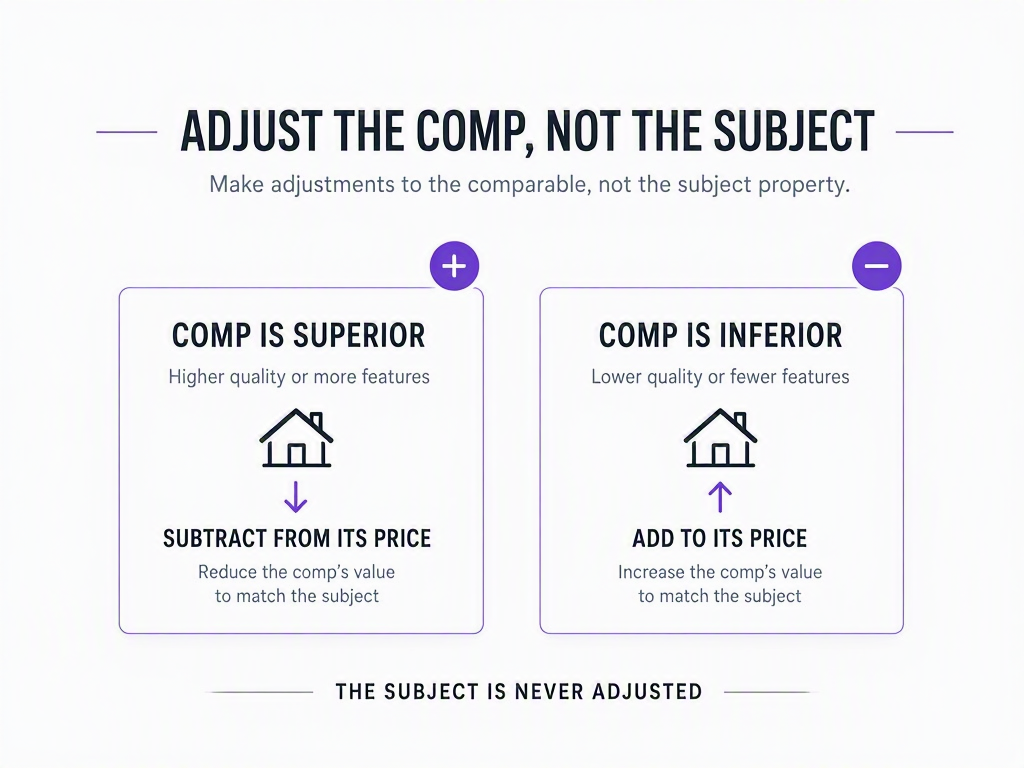
Screened comps still differ from the subject: an extra bath here, 200 more square feet there. The adjustment grid handles this, and it is the heart of the method: you adjust the comp's sale price toward the subject, never the other way.
Which direction does the adjustment go? The mnemonic that survives contact with real work: give the comp the subject's features, then re-price it. If the comp has a bath the subject lacks, that bath's value comes off the comp's price (comp superior, subtract). If the comp is missing a garage bay the subject has, its value goes on (comp inferior, add). This is the same grid that sits at the center of a licensed appraisal; Fannie Mae's selling guide describes the professional version if you want to see how deep the rabbit hole goes.
Where do the dollar values per feature come from? Not from a national lookup table, because there isn't one. Appraisers derive them from paired sales: find two sales identical except for one feature, and the price gap prices that feature. The values below are illustrative round numbers for a generic suburban market, used so the mechanics are easy to follow. Derive your own from local pairs before you ship anything.
The worked example: subject is a 3-bed, 2-bath, 1,850 sqft house with a 2-car garage, in average condition. Three screened comps:
| Sold | Sqft | Baths | Garage | Condition | Net adj. | Adjusted | |
|---|---|---|---|---|---|---|---|
| Comp A | $505,000 | 1,990 | 3 | 2 | avg | −$25,800 | $479,200 |
| Comp B | $462,000 | 1,780 | 2 | 1 | avg | +$20,400 | $482,400 |
| Comp C | $538,000 | 1,905 | 2 | 2 | renovated | −$21,600 | $516,400 |
And the code that produces it, using $120/sqft for living area, $9,000 per bath, $12,000 per garage bay, and $15,000 per condition step:
const ADJ = { perSqft: 120, perBath: 9000, garageBay: 12000, conditionStep: 15000 };

function adjust(comp, subject) {
  const lines = [
    { feature: "GLA",       delta: (subject.sqft - comp.sqft) * ADJ.perSqft },
    { feature: "Baths",     delta: (subject.baths - comp.baths) * ADJ.perBath },
    { feature: "Garage",    delta: (subject.garage - comp.garage) * ADJ.garageBay },
    { feature: "Condition", delta: (subject.condition - comp.condition) * ADJ.conditionStep },
  ];
  const net = lines.reduce((s, l) => s + l.delta, 0);
  const gross = lines.reduce((s, l) => s + Math.abs(l.delta), 0);
  return { adjusted: comp.price + net, net, gross, grossPct: gross / comp.price, lines };
}
Note the two totals. Net adjustment is what moves the price. Gross adjustment (the sum of absolute values) measures how much surgery the comp needed, and it is your built-in quality score: a comp that needed 25% gross adjustment was never really comparable, no matter how neatly the net works out. Appraisal guidelines commonly flag high-gross comps for exactly this reason.
Step 5: Reconcile to a Range, Not a Point
Three adjusted prices now need to become one answer. An appraiser reconciles with judgment; in code, the honest equivalent is weighting each comp by how little you had to touch it:
const results = comps.map(c => ({ c, r: adjust(c, subject) }));
const wts = results.map(({ r }) => 1 / (0.01 + r.grossPct)); // less surgery, more weight
const totW = wts.reduce((s, w) => s + w, 0);
const indicated = results.reduce((s, { r }, i) => s + r.adjusted * wts[i], 0) / totW;
Indicated value: $493,821 (range $479,200 to $516,400)
Comp A weight: 29.9%
Comp B weight: 33.7%
Comp C weight: 36.4%Report all of it: the point, the range, and the weights. A stakeholder who sees "$493,821, supported by three sales adjusted between 4% and 5.1% gross" can interrogate the reasoning. A stakeholder who sees "$493,821" can only believe you or not.
Step 6: A Tiny AVM, and Exactly Where It Breaks
An AVM generalizes this: instead of hand-picking and adjusting a few comps, model the relationship between features and price over many sales. Here is the smallest version that is still honest, a similarity-weighted price per square foot:
function simpleAvm(comps, subjectSqft) {
  const weighted = comps.map(c => {
    const w = 1 / (1 + Math.abs(c.sqft - subjectSqft) / subjectSqft);
    return { ppsf: c.price / c.sqft, w };
  });
  const totalW = weighted.reduce((s, x) => s + x.w, 0);
  const ppsf = weighted.reduce((s, x) => s + x.ppsf * x.w, 0) / totalW;
  return { ppsf, estimate: ppsf * subjectSqft };
}
Run it on the real Honolulu comp set, subject at 1,937 sqft, and compare against ground truth we already have from Step 1:
unscreened candidates: $204/sqft → $394,320
screened (same building): $127/sqft → $246,499

actual last sale:  $245,000   (toy AVM off by 0.6%)
zestimate:         $238,500
Twelve lines of arithmetic, run on two properly screened comps, landed within 0.6% of the subject's actual May 2025 sale price, slightly closer than the Zestimate. Before that goes on anyone's slide deck: it worked because the screened comps were close substitutes (same building, similar size, identical cost structure), and because that segment has moved little since the sale. The same twelve lines on the unscreened pool missed by 61%. The model did not get smarter between those two runs; the evidence got cleaner.
And when I tried to be cleverer than that, the data said no. A linear regression fit on the two same-building sales yields a slope of −$914 per additional square foot, which cheerfully asserts that bigger units are worth less. With two data points, a regression is not a model, it is a line through your noise. Every AVM is a comparative market analysis run at scale, with human judgment swapped for statistics, and the statistics need a volume of sales that one building cannot supply. Production AVMs earn their keep with hedonic feature models, time adjustment, and error bands, which is a different article: we covered that architecture in building a pricing engine with real estate APIs.
When a CMA Beats an AVM (and Vice Versa)
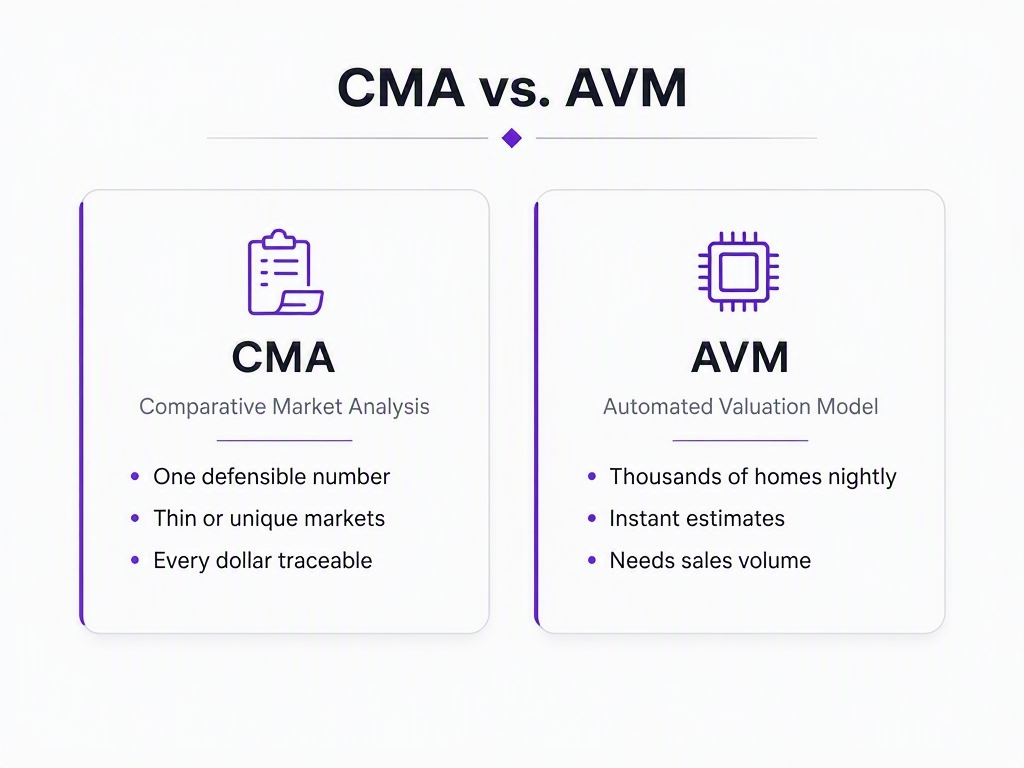
While writing this post I also pulled comps for a very different property: a 7,526 sqft estate in Jacksonville's Avondale, built in 1927, last sold at $4.25M. The comps endpoint returned exactly one candidate. That is not a bug. At that price point in that neighborhood there is barely a market to be comparable to. No grid, no regression, and no AVM fixes n=1; that valuation is judgment work, informed by whatever evidence exists.
| Situation | Reach for | Why |
|---|---|---|
| One number you must defend (list price, offer, dispute) | CMA | Every dollar traces to a sale and an adjustment |
| Pricing thousands of properties nightly | AVM | Nobody hand-screens comps at portfolio scale |
| Thin or luxury markets, unique properties | CMA, uncomfortably | Models starve without volume; judgment degrades more gracefully |
| Instant ballpark to screen leads | AVM | Speed matters more than the error band |
| Dense, homogeneous segments (condo buildings, tract homes) | Either | As Step 6 showed, even a toy model gets close when substitutes are near-perfect |
They also cross-check each other cheaply. The subject's own record carried a zestimate field, and Redfin's estimate is one call away on the Redfin API. If your CMA and two independent AVMs disagree wildly, something in your comp set (or their coverage) wants investigating before money moves. For the market-level context around any of these numbers, start with real estate market analysis.
Key Takeaways
- Screen before you average. One unscreened comp turned a 0.6% error into a 61% error on real data. No downstream math recovers from bad evidence.
- Adjust the comp toward the subject, never the subject. Give the comp the subject's features and re-price it: comp superior, subtract; comp inferior, add.
- Gross adjustment is your comp quality score. Track it, weight by it, and distrust any comp that needed heavy surgery even if the net looks tidy.
- Ship the range and the weights, not just the point. "$493,821" is a claim; "three sales, adjusted 4 to 5.1% gross, indicating $479K to $516K" is an argument.
- Trust a toy AVM exactly as far as its comp screen. Near-perfect substitutes make simple models look brilliant; thin data makes clever models embarrassing.
Everything in this walkthrough runs on two endpoints, /pro/byaddress and /comparable_homes, at one credit per call, so reproducing every request in this post costs single-digit credits. Grab a key, point the code at an address you personally know, and check whether the comp candidates would survive your screen. If your first result looks off by 60%, congratulations: you found your Barclay unit, and now you know what to do with it.