Rent Per Sq Ft Explained: Formula, Benchmarks and Trends
Rent per square foot equals rent divided by the area it covers, usually monthly for homes and annual for commercial space. A commercial quote of $24 per square foot on 5,000 square feet means $120,000 a year, or $10,000 a month, before additional charges.
You're comparing listings, and one looks cheaper until you notice that its rent excludes operating expenses or includes shared corridors in the billed area. The arithmetic is simple. The harder part is establishing what the rent covers, which area it measures, and when the quote applies.
Treat every rent per sq ft figure as a labeled measurement, not a standalone price. That habit helps renters compare options, landlords set defensible asking rents, and developers build tools that don't rank incompatible listings together.
The Formula and Its Common Variations
Rent per square foot is rent divided by area. It's a unit price, much like the price per litre on a supermarket shelf, and it only helps when you're comparing equivalent quantities.
Every calculation needs a time period and an area definition. A monthly residential rate and an annual commercial rate aren't directly comparable, even if both listings display the same currency symbol and square-foot abbreviation.
The commercial arithmetic in Tyler Cauble's guide to calculating rent uses 5,000 square feet at $24 per square foot annually, producing $120,000 in annual base rent, or $10,000 monthly, before additional charges.
Rent per square foot formulas by property type
The residential rows below are hypothetical worked examples. The commercial all-in row previews a calculation whose individual charges are explained under occupancy cost.
| Variant | Formula | Worked example | Result |
|---|---|---|---|
| Monthly residential | Monthly rent ÷ sq ft | Hypothetical $2,400 ÷ 800 sq ft | $3.00 per sq ft per month |
| Annual residential | (Monthly rent × 12) ÷ sq ft | Hypothetical $2,400 × 12 ÷ 800 sq ft | $36.00 per sq ft per year |
| Commercial base rent | Annual rate × rentable sq ft = annual base rent | $24 × 5,000 sq ft | $120,000 a year, or $10,000 a month |
| Commercial all-in (triple net) | (Annual base rent + annual net charges) ÷ sq ft | Add already-normalized annual rates of $24 + $9.75 | $33.75 per sq ft per year |
Notice the difference between calculating a rate and calculating a total. Dividing rent by area gives a rate. Multiplying a rate by area gives the rent payable for that period.
The last row also contains an important unit check. When base rent and net charges are already expressed per square foot, add them directly. Divide by area only when the inputs are total dollar amounts, or you'll divide by the area twice.
Convert the period before comparing
To convert a monthly rate to an annual rate, multiply it by the number of months in a year. To convert annual rent into a monthly payment, divide it by that same number.
This conversion changes the presentation, not the underlying cost. It doesn't tell you whether utilities are included, whether the area is usable, or whether a concession reduces the amount payable.
Practical rule: Write the rent period and area definition beside the original quote before doing any division.
Keep the original advertised figure in your spreadsheet alongside the normalized calculation. If a result looks implausibly cheap or expensive, you can inspect the inputs rather than trying to reconstruct the listing later.
Choosing Between Usable and Rentable Square Feet
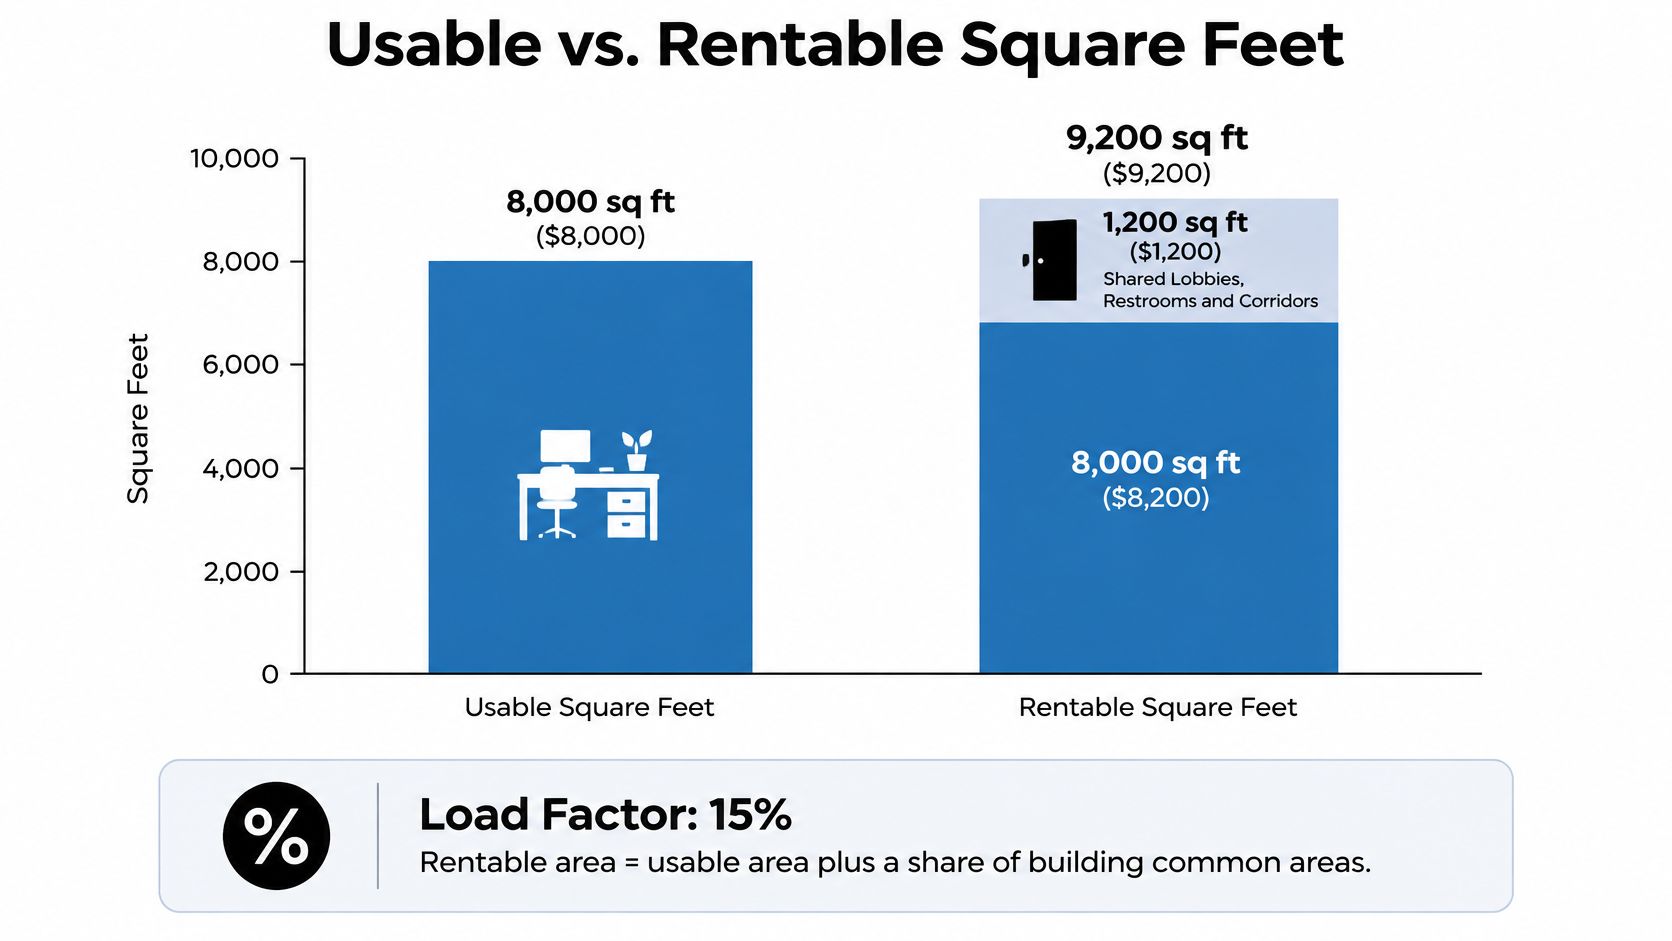
A tenant can pay for more square footage than the business occupies exclusively. Usable square feet, often abbreviated USF, describe the tenant's occupied space. Rentable square feet, or RSF, add an allocated share of building common areas.
The difference can include shared lobbies, restrooms, and corridors. Those facilities have value, but they aren't interchangeable with private offices, storage space, or customer-facing floor area.
This illustration separates the occupied area from the additional common-area allocation.
How the load factor changes the bill
The load factor expresses the addition between usable and rentable area. Office Consumer's commercial lease guide identifies typical additions of roughly 12% to 18% and illustrates how 10,000 usable square feet with a 15% load factor becomes 11,500 rentable square feet.
For the hypothetical comparison below, hold the usable area and quoted annual rate constant. Only the common-area allocation changes.
Same 10,000 usable sq ft at a $24 quoted rate, by load factor
| Load factor | Rentable sq ft billed | Effective annual base rent per usable sq ft |
|---|---|---|
| 0% (no common area share) | 10,000 | $24.00 |
| 12% | 11,200 | $26.88 |
| 15% | 11,500 | $27.60 |
| 18% | 11,800 | $28.32 |
These are calculated scenarios, not market rent estimates. Each effective rate comes from multiplying the quoted rate by billed rentable area, then dividing the resulting annual rent by usable area.
The advertised rate never changes, but the cost of the space the business actually occupies does. A smaller suite with a heavier common-area allocation can therefore cost more per usable foot than a larger suite with a lighter allocation.
Ask the landlord to provide both area measurements and the load factor in writing. Also confirm whether the quoted factor is expressed as a percentage addition or as a rentable-to-usable multiplier.
For another explanation of how these measurements appear in a leasing discussion, this video provides additional context.
Check residential area definitions too
Residential listings require a different question: what did the listing provider count as living area? Check whether balconies, garages, unfinished basements, or other ancillary spaces are included rather than assuming every advertised square foot serves the same purpose.
Unconventional homes also need consistent classification before comparison. CozyCube's guide to understanding tiny home classifications offers useful context when deciding which properties belong in the same comparison group.
The denominator should describe space you can meaningfully use for your intended purpose. If its definition is unclear, mark the calculation as provisional.
Turning Base Rent Into Total Occupancy Cost
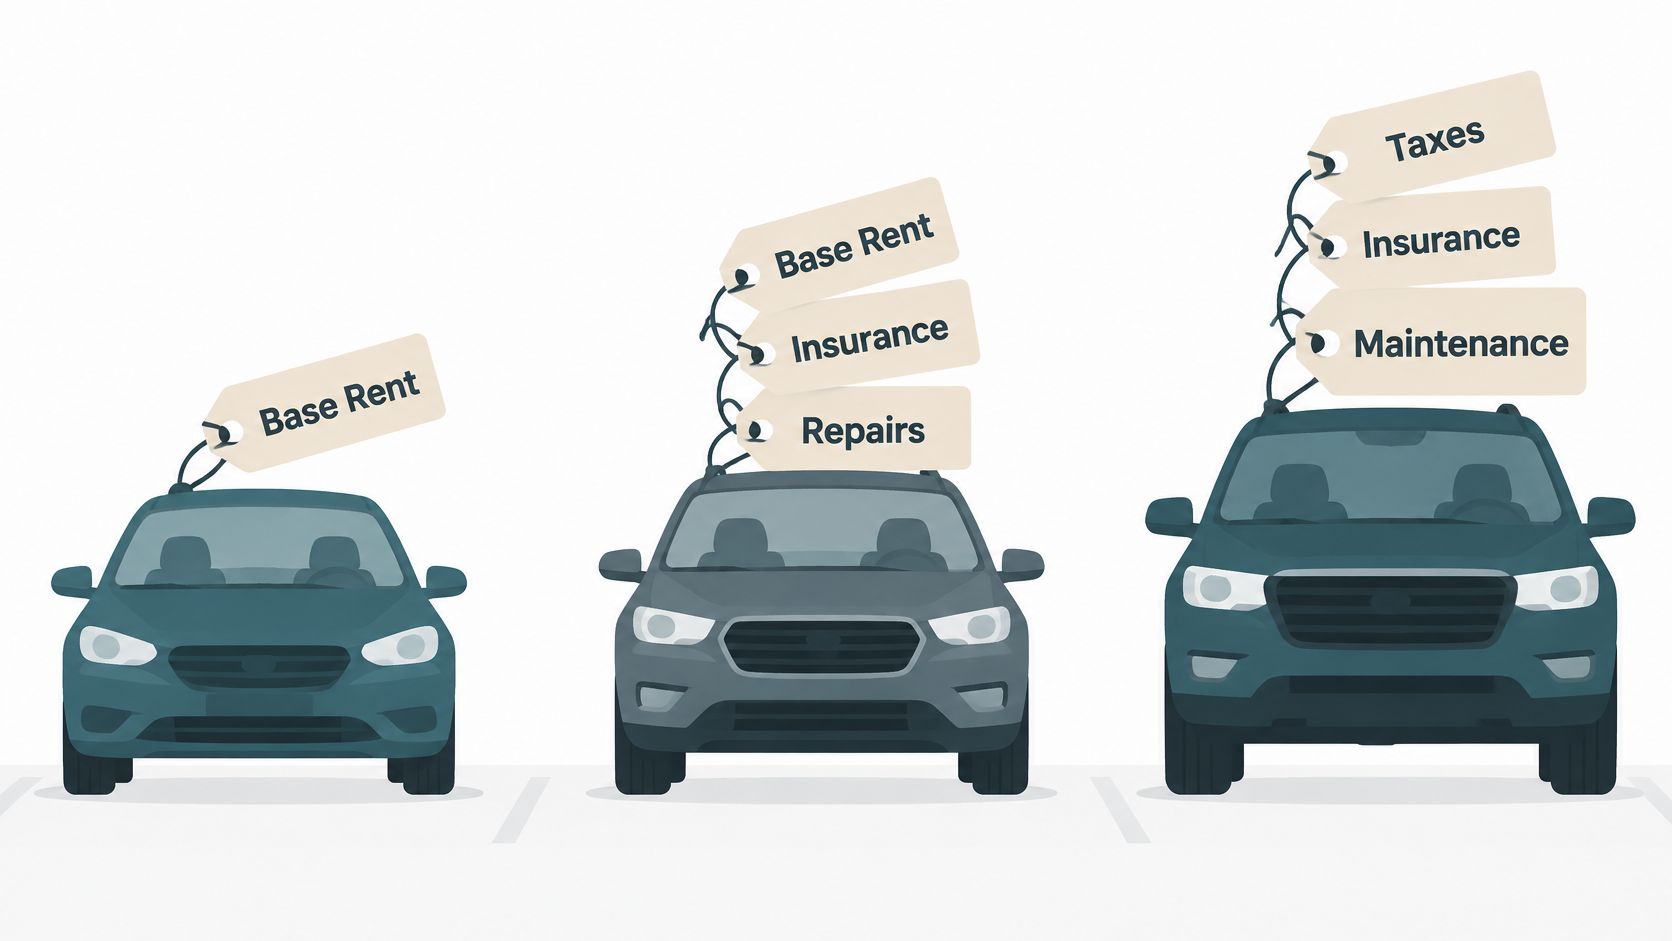
Base rent is like a car's sticker price. A net lease can add the equivalent of registration, insurance, and maintenance costs after you've settled on that initial number.
A full-service gross lease generally bundles building operating costs into the quoted rent, subject to the lease's exclusions. A modified gross lease divides responsibilities and may pass increases above a base-year amount to the tenant. Under a triple-net lease, the tenant pays base rent plus its allocated property taxes, building insurance, and common-area maintenance.
The visual below distinguishes those layers of cost.
Build the annual total
The Tools.realestate triple-net lease calculator illustrates $24 in annual base rent per square foot, plus $3.50 for taxes, $1.25 for insurance, and $5.00 for common-area maintenance, producing $33.75 per square foot, or $168,750 annually on 5,000 square feet.
In that worked scenario, the all-in rate is approximately 40.6% above base rent, calculated by dividing the additional charges by the base rate. A hypothetical $30 full-service gross quote would cost less than that triple-net option if it covered equivalent expenses and used the same area basis.
Don't stop at the lease label. Review the actual inclusions and exclusions:
- Utilities and services: Establish who pays for electricity, water, cleaning, and telecommunications.
- Parking: Separate mandatory charges from optional spaces.
- Concessions: Distinguish temporary free rent from the recurring contractual rate.
- Variable expenses: Identify estimates that may be reconciled against actual costs.
For residential applications, an apartment rental-cost details endpoint can support a more complete cost record than base rent alone, subject to the fields available for each listing.
Compare total annual occupancy cost divided by usable area, not an inclusive quote against someone else's base rent.
Keep recurring operating costs separate from refundable deposits and one-time moving expenses. They affect different decisions, even when all of them matter to the cash needed at move-in.
Confirm the Basis Before You Compare Listings
A lower advertised rent per sq ft can be the worse deal. That happens when the tenant receives less usable space for the billed area, or when the quote leaves out charges included in another listing.
Kadence's explanation of rentable versus usable square feet describes the distinction between occupied space and the common-area allocation added to billed area. That distinction is enough to make an apparently simple ranking unreliable.
Use this visual as a reminder of the questions to resolve before sorting by price.
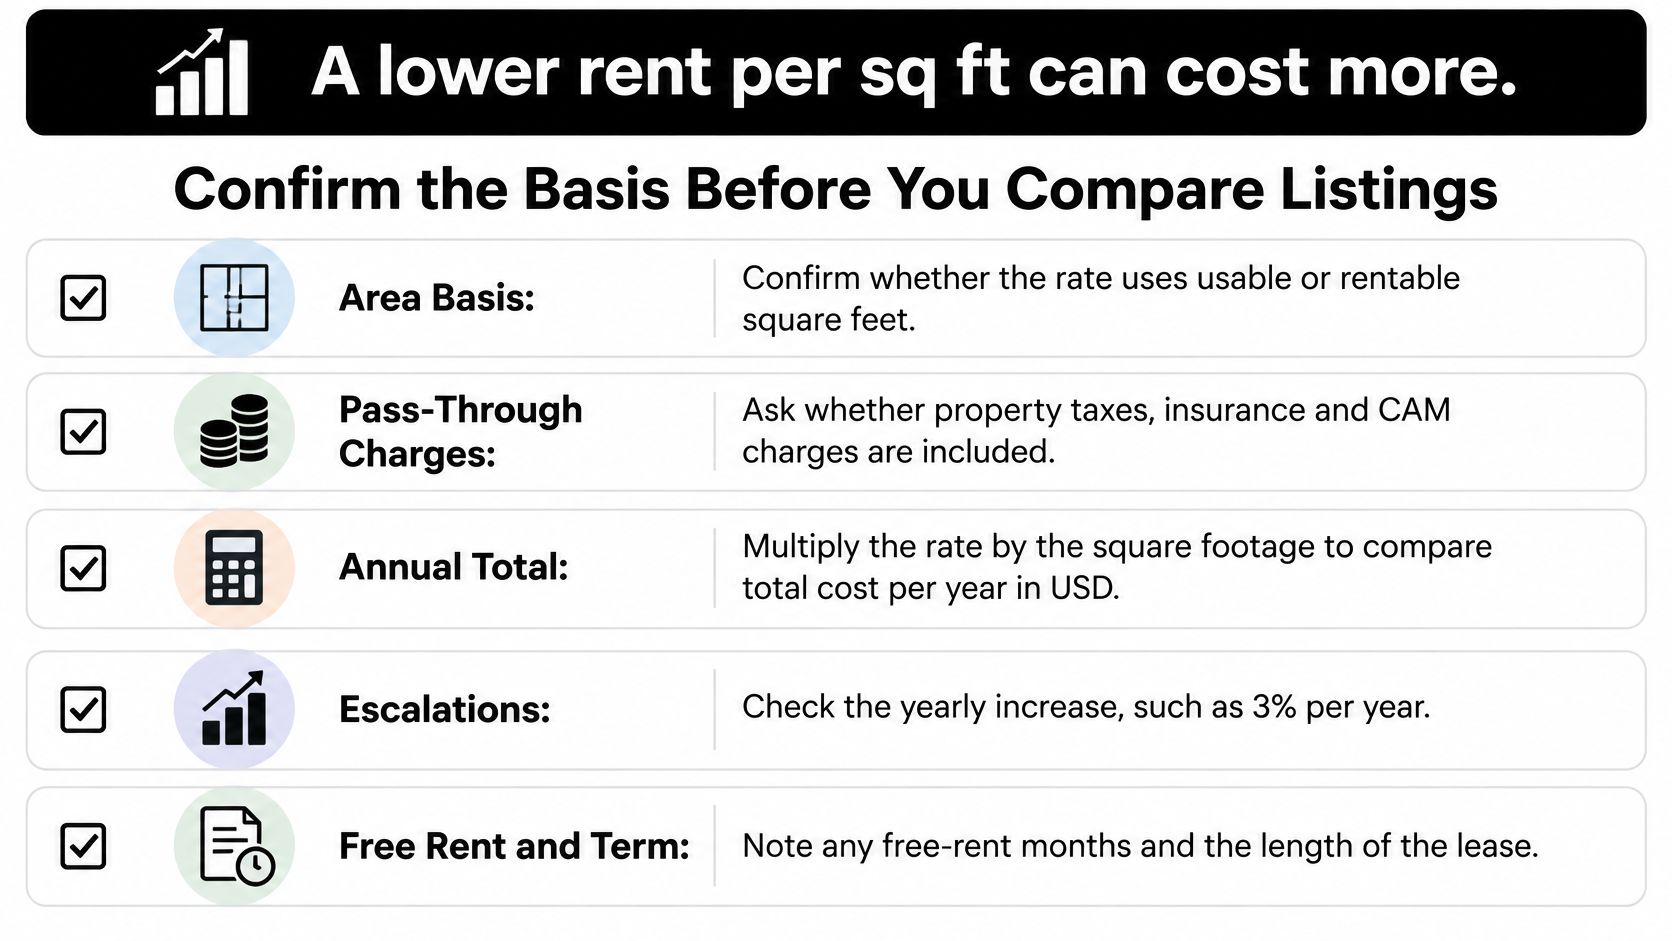
A comparison checklist
- Period: Confirm whether each quote is monthly or annual, then convert both to the same period.
- Area basis: Record usable area, rentable area, and the stated load factor. An unlabeled area field isn't sufficient.
- Lease structure: Identify gross, modified gross, or triple net, and document which operating charges the figure includes.
- Concessions: Allocate free rent across the full lease term when calculating an effective rate. Keep the contractual payment schedule visible too.
- Asset class and submarket: Compare office with office and retail with retail. Match location and quality tier rather than pooling prime and secondary properties.
- Price basis and date: Separate nominal figures from inflation-adjusted figures, and preserve the observation date.
If the period, area basis, or lease structure is unresolved, don't rank the listings. First restate both as annual occupancy cost per usable square foot, or identify the missing input that prevents that calculation.
Keep unknowns visible
For an application, missing information should remain missing, not become a zero. An unknown operating-expense charge doesn't mean the tenant owes nothing, and an absent usable-area field doesn't justify substituting rentable area without saying so.
A commercial property search by location can help assemble candidate listings. The comparison layer should then retain their original units, expense descriptions, and measurement dates.
The same discipline applies when readers compare homes using square-foot pricing, as Home Ready Calculator explains in its residential pricing guide. Use the rate to identify properties worth examining, then assess condition, layout, location, and total cost before calling one better value.
Market Benchmarks You Can Compare Against
A quoted rent becomes a useful benchmark only after you know its market, asset class, observation date, rent period, and measurement basis. A headline number without those details is like a ruler with no units: it may look precise but cannot support a fair comparison.
Recent office and retail asking rent benchmarks
| Market | Asset class | Latest value | Period and basis |
|---|---|---|---|
| Manhattan, New York | Office | $73.19 per sq ft | Q4 2025, average asking rent |
| San Bernardino County, California | Office | $2.19 per sq ft | Q4 2025, inflation-adjusted asking rent |
| San Bernardino County, California | Retail | $1.73 per sq ft | Q4 2025, asking rent, down from $1.82 in Q4 2024 |
The New York State Comptroller's office-market report places Manhattan's Q4 2025 average asking office rent at $73.19 per square foot, the highest among the U.S. peer markets examined. It was 2.2% above its level a decade earlier. The report also records a decline to $69.67 by the end of 2021, followed by a recovery that still left asking rent slightly below its pre-pandemic level.
The San Bernardino County commercial real estate indicators report Q4 2025 office asking rent of $2.19 per square foot and retail asking rent of $1.73. Office rent was down 13% in inflation-adjusted terms over ten years. These figures describe that county's market, not a universal office or retail rate. Check the underlying series' rental time unit before comparing it with another market, since an unconfirmed period can make two otherwise similar figures misleading.
Calculate change without losing context
Use this formula:
Percentage change = (new rent − old rent) ÷ old rent × 100
For a local trend series, compare values measured on the same basis and over a stated interval. The calculation gives the change between those observations, not a complete account of why rents moved or what a particular property should cost.
A rental market trends endpoint can support local monitoring. Check what its series measures, such as asking rent, achieved rent, a median, or an index, before interpreting a change. A median and an index are different yardsticks, even when both are labeled as rent trends.
Benchmark discipline: Match the market and property type, then confirm the time period and measurement basis. A benchmark helps frame a comparison; it does not replace the listing's underlying details.
Space Affordability for Homes
A lower rate per square foot doesn't automatically make a home affordable. Consider a hypothetical central apartment at $2,400 a month for 650 square feet, approximately $3.69 per square foot, and a suburban home at $2,000 for 1,200 square feet, approximately $1.67 per square foot.
The suburban home is cheaper on both measures in this example, but it could still exceed the household's budget. The central apartment might offer a shorter commute or a more suitable location, while the larger home might better accommodate a family or home office.
Start with the household's budget
A useful calculation is:
Affordable usable area = monthly rent budget ÷ monthly rent per square foot
For example, a hypothetical $2,000 budget at $2.50 per square foot buys 800 square feet. Treat that as a search constraint, not a promise that a suitable unit exists at that exact size and price.
Zillow's analysis of rentals affordable on a six-figure income reports a 2026 median listed rent of $1,750, while median affordable space for households earning at least $100,000 ranges from about 650 square feet in San Jose to 1,848 square feet in Houston. The same analysis reports that July 2026 asking rents across the largest 50 U.S. metros fell 1.4% year over year but remained 15.3% above pre-pandemic levels.
Those are distinct measures. Neither a national rent figure nor a metro-level change tells you whether a particular household can afford a suitable home in its preferred neighborhood.
- Set the payment limit: Use a rent affordability calculator alongside the household's actual recurring expenses.
- Compare similar homes: Group local listings by bedroom count and neighborhood before calculating median rent per square foot.
- Keep practical fit visible: Record layout, usable space, commute requirements, and mandatory monthly charges.
Check whether a listing sits above or below its local group's median, then ask what explains the difference. Pair the rate with monthly total, income, unit size, neighborhood, and date, rather than using it as a standalone affordability score.
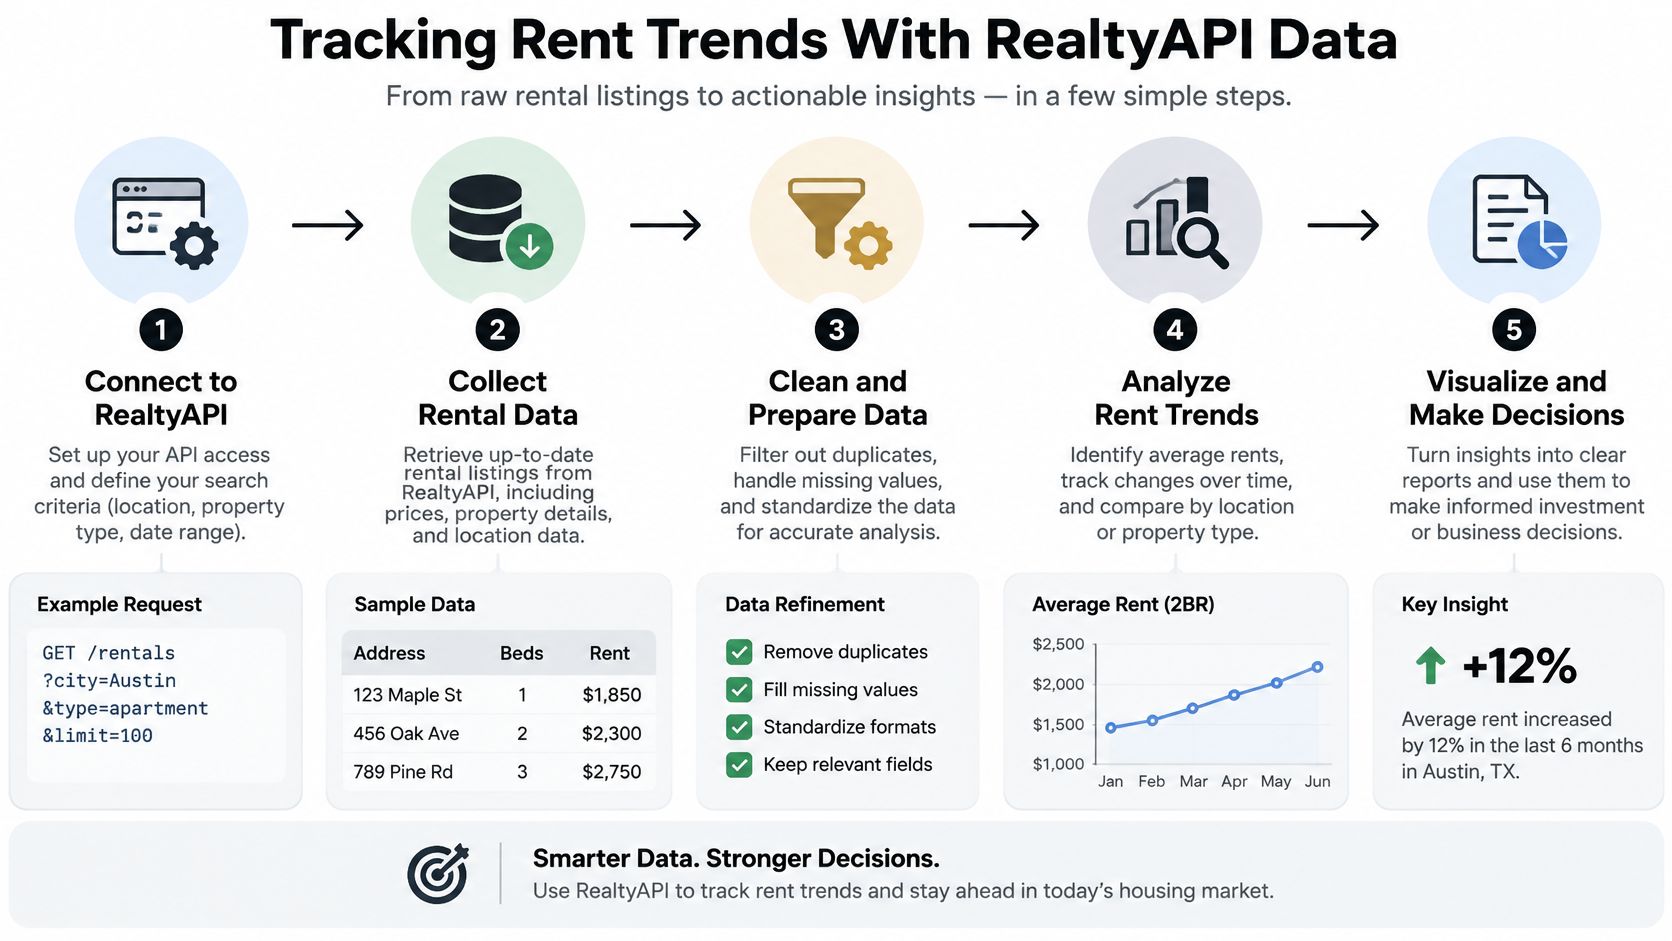
Tracking Rent Trends With RealtyAPI Data
A rent-per-square-foot figure is comparable only when its area, time period, lease basis, and observation date are clear. Keep those fields with every listing record, along with the search area and listing type. Otherwise, a shift in the monthly median may reflect a different mix of listings rather than a change in rent.
The New York City Comptroller's office-market analysis concerns New York City office-market conditions, so it does not establish the London rent figures sometimes used to illustrate long-term trends. For your own series, retain dated observations and compare like with like.
Build a reproducible monthly calculation
- Configure access: Get an API key and confirm the documented endpoint, authentication method, and response fields.
- Search one area: Use the same destination, coordinate boundary, or place identifier each time. Retrieve all relevant result pages.
- Clean rental records: Exclude sale listings, duplicates, missing prices, and missing or nonpositive living areas. Convert prices to monthly rent and areas to square feet.
- Calculate listing rates: Divide monthly rent by living area for each retained record.
- Group observations: Calculate medians by observation month and bedroom count.
- Compare matching periods: Compare each group with the same month a year earlier or with a fixed baseline.
This Python template uses requests and pandas. Set the endpoint through an environment variable, then replace the illustrative parameter names, authentication header, response path, and fields with their documented equivalents before running it.
import os
import requests
import pandas as pd

response = requests.get(
    os.environ["LISTING_SEARCH_ENDPOINT"],
    headers={"X-API-Key": os.environ["LISTING_API_KEY"]},
    params={"location": os.environ["SEARCH_AREA"]},
)
response.raise_for_status()
df = pd.json_normalize(response.json()["listings"])

# Illustrative fields, confirm and normalize before use.
df = df[df["listing_type"].eq("rental")].copy()
df = df.drop_duplicates("listing_id")
for field in ["monthly_rent", "living_area_sqft"]:
    df[field] = pd.to_numeric(df[field], errors="coerce")
df = df.dropna(subset=[
    "monthly_rent", "living_area_sqft",
    "bedrooms", "observed_at"
])
df = df[
    df["monthly_rent"].gt(0) &
    df["living_area_sqft"].gt(0)
]
df["rent_psf"] = df["monthly_rent"] / df["living_area_sqft"]
df["month"] = pd.to_datetime(df["observed_at"]).dt.to_period("M")
series = df.groupby(["month", "bedrooms"])["rent_psf"].median()
print(series)
Save each search result with its observation date before grouping. One current search cannot recreate earlier market conditions unless the returned records include suitable historical observations.
Read sample output cautiously
Illustrative monthly median rent per sq ft from one listing pull
| Month | Median living area | Illustrative median monthly rent per sq ft |
|---|---|---|
| January 2026 | 800 sq ft, hypothetical | $2.76 |
| February 2026 | 800 sq ft, hypothetical | $2.70 |
| March 2026 | 800 sq ft, hypothetical | $2.65 |
| April 2026 | 800 sq ft, hypothetical | $2.60 |
These hypothetical values show how a monthly series could be presented, not observed market results. A downward pattern across four months may suggest softening, but collect at least twelve months as a practical minimum before judging annual patterns. Check whether the listing mix changed, since a different set of properties can move the median even when comparable rents have not shifted.
Keep asking rents separate from signed leases. Distinguish newly listed properties from repeated observations of the same property, and remove sale records that entered the rental search.
RealtyAPI.io provides property searches, listing details, and market signals through one API, with REST, GraphQL, and webhooks. Developers can use its public-listing data to build rental comparisons and market-monitoring tools, with a free testing tier and code examples in Python, JavaScript, Go, and PHP. Visit RealtyAPI.io to obtain an API key and test a local rental search, keeping the price period, area basis, lease structure, and observation date visible.