Real Estate Search by Map: How to Build It Right in 2026

You've got the map rendering, the pins loading, and a user testing your build on their phone. They drag across a neighborhood they know well, zoom in on a street with three homes for sale, and only two pins appear. There's no error, no empty state, and no failed request in your logs. One listing has vanished, and another sits two blocks from where it should be.
That's the usual failure mode for real estate search by map. It doesn't crash. It misplaces, drops, duplicates, or skips homes while returning a successful response. I'd build it backward from those silent failures, starting with the query shape, then validation, exact filtering, deterministic sorting, and rendering. Get those layers right and the interface becomes the easy part.
Four Query Inputs That Define a Map Search
A map drag can trigger four different searches: a radius around the center, listings inside the visible rectangle, properties in a named area, or results inside a drawn boundary. Choose the input deliberately. Mixing them can make counts shift or listings disappear at the edges.
Let the Gesture Pick the Input
A pan or zoom usually supplies a bounding box. A drawn area supplies a polygon, which preserves the user's chosen edges instead of expanding them to a rectangle. For a city, neighborhood, or postcode, use a place ID. Autocomplete suggestions let users select a known identifier rather than sending free text that the search service must interpret.
| Input | Format | Best use | Watch out for |
|---|---|---|---|
| Point and radius | Center latitude and longitude plus radius in meters | Nearby searches from a pin or address | Calculate distance geodesically; degrees are not flat distance units |
| Bounding box | Southwest and northeast latitude and longitude corners | Visible map area after a pan or zoom | Viewport bounds reflect what is visible, not necessarily the user's full search intent |
| Polygon | Ordered ring of longitude and latitude pairs, closed | Drawn neighborhoods or custom investment areas | Close the ring; very large polygons may need splitting |
| Place ID | Provider identifier for a city, neighborhood, or postcode | Named-area searches and saved areas | Postcode resolution can be less reliable than area IDs |
Postcode searches depend on whether a provider can resolve the code to one of its own areas. If both a postcode and an area ID are available, query by area ID and retain the postcode as display text. For suggestions, use an autocomplete endpoint for place selection so the selected place maps to a recognized identifier.
Large drawn areas also need a limit. Zillow's custom-area help page states a 700-square-kilometer maximum. For a larger area, split the polygon into smaller searches, then merge and deduplicate the results.
Logging habit: Record the input type with each request. When listings are missing, that record shows whether the query used a box, polygon, radius, or place ID.
Build the Request and Catch Silent Misplacements
Build every request the same way, in the same order. A deterministic pipeline gives you reproducible failures, and reproducible failures are fixable ones.
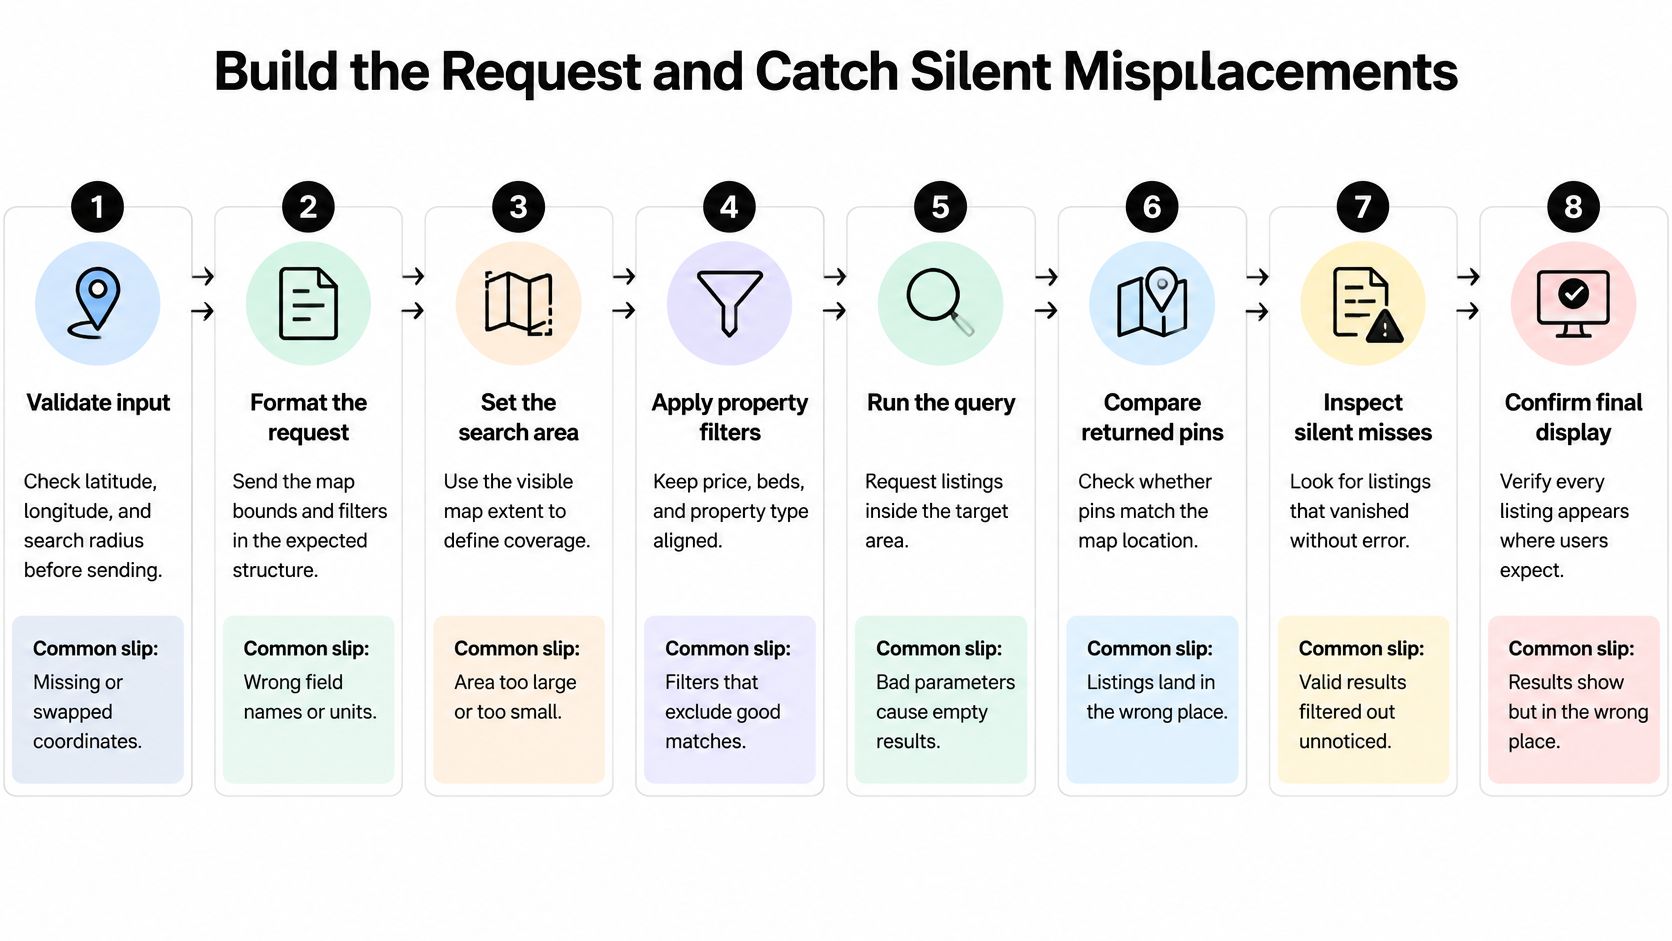
Eight Steps in Order
Validate input. Latitude sits between -90 and 90, longitude between -180 and 180, both southwest and northeast corners are present, and southwest sits below and left of northeast. Google's Geocoding API documentation defines a viewport as a closed rectangular region and states that an empty rectangle causes an error, so reject empty or reversed boxes before you send anything. The common slip is accepting swapped corners and querying a box that contains nothing.
Fix one coordinate reference system. Store canonical coordinates in WGS 84 longitude and latitude and convert Web Mercator display coordinates on input so they never reach storage. The Open Geospatial Consortium discussion paper identifies CRS ambiguity as a fundamental interoperability problem, and OGC API Features uses WGS 84 longitude/latitude (CRS84) as its default, so confirm axis order at every boundary and return CRS metadata with geometry.
Pad the viewport. Expand the visible area by 5% to 10% so listings near the edges are fetched before the user pans a few pixels. Skip this and edge listings flicker in and out.
Query the padded envelope. Use the padded box for candidate retrieval through your spatial index or listings endpoint. This step favors recall. Precision comes next.
Apply exact filtering, then drop the padding. Run a Haversine distance check for radius searches or a point-in-polygon test for drawn shapes. Degrees aren't uniform distance units, so use a geodesic calculation or a local projected CRS across large areas. The slip is doing Euclidean math on degrees and watching accuracy decay with distance from the equator.
Deduplicate by stable property ID. Overlapping tiles and pages return the same home twice. Deduplicate before you count, cluster, or render.
Sort deterministically before slicing. Sort by your primary key, say price, then by property ID as the tie-breaker. An unstable sort makes page two skip homes or repeat homes from page one whenever two listings share a price.
Paginate with a cursor and cancel stale requests. When the user pans again, cancel or ignore in-flight requests for the old view. A slow response for the previous neighborhood shouldn't overwrite the current one.
A correct response is easy to recognize. Every returned coordinate falls inside the requested shape, each property appears once, and the cursor for page two continues exactly where page one stopped.
Diagnosing Homes That Vanish
Silent failures return fewer homes than expected without an error. Each one maps to a check you've already built.
- Swapped latitude and longitude: A city lands in the ocean. Validate ranges and reject axis-order confusion at input, since a longitude value sitting in the latitude field often still parses as a valid number.
- Web Mercator stored as WGS 84: Every listing shifts. Convert on input and store one canonical CRS, because display coordinates and storage coordinates serve different jobs.
- Antimeridian-crossing boxes: Homes on one side of 180 degrees disappear. Split the box at 180 degrees, run both halves, and merge the results.
- Viewport bias treated as a filter: Geocoders treat a viewport as a preference. Google's documentation states that location bias does not guarantee containment, so filter returned coordinates against your requested bounds in your own code. Prefer near this area and return only inside this area are different promises.
- Duplicate pages: Overlapping retrieval inflates counts and makes clusters lie. Deduplicate by property ID before counting.
- Unstable sorting: Homes vanish between pages. Use a deterministic key with ID as the tie-breaker.
- Stale responses: Fast panning shows listings for the previous view. Tag each request with a sequence number and ignore responses for superseded requests.
Run one reproducible test before you ship. Pick a known address, query a box that contains it, confirm it appears exactly once, and confirm every returned coordinate falls inside the box. Viewports are closed rectangles, so boundary points count as inside.
If that test fails, don't touch the UI. Print the raw request, the CRS, and the first ten coordinates. The bug is almost always visible at that level.
Clustering and Pagination for Dense Map Results
Your render strategy has to change with zoom. A country view and a street view are different products sharing one map, and sending the same payload to both wastes bandwidth at one end and hides detail at the other.
Starting Values by Zoom Band
| Zoom band | Typical view | Render strategy | Data returned |
|---|---|---|---|
| Zoom 3-8 | Country or large region | Server-side cluster counts | Counts and centroids only, no listing cards |
| Zoom 9-12 | City | Grid clusters with capped pins per tile | Cluster counts plus a capped set of pins |
| Zoom 13-15 | Neighborhood | Individual pins with cursor paging | Pins plus a cursor for the rest of the tile |
| Zoom 16 and above | Street | Individual pins, details on tap | Pin data first, full card data on selection |
At country scale, return server-side cluster counts with no listing payload. Shipping thousands of cards to draw a bubble with a number in it is pure waste. At city scale, cap individual pins per tile and show the hidden count inside each cluster, so users know how many homes they aren't seeing yet. At neighborhood scale, draw individual pins and page the rest. At street scale, load full card data only when someone taps or clicks a pin.
The trade-off is honest. Clusters are cheap to draw but hide homes. Individual pins are accurate but expensive, and past a few hundred DOM markers or map annotations, panning starts to stutter on mid-range phones.
Say a city view matches 3,000 homes and your grid allows 200 pins per tile. The user sees clusters with counts, zooms into one tile, and you fetch its next 200 through the cursor. Nobody downloads 3,000 cards to look at one neighborhood.
Why Cursors Beat Page Numbers
Prefer cursor tokens over page numbers. Listings get added and removed while a user browses, and a page number points at a position in a list that's shifting underneath it. Page three after an insertion isn't the page three the user expected. A cursor anchored to your deterministic sort key continues from a specific listing, so insertions ahead of it don't shift what comes next. Check the rate limits documentation for your provider before you set tile and page sizes, since aggressive prefetching across tiles multiplies request volume fast.
Test it with a number you can measure. At 1,000 visible results, panning should still feel responsive on a mid-range phone. A clustered count should also match the sum of its children exactly. If a cluster says 240 and its children add to 237, your deduplication or your filter timing is off, and users will find the three missing homes before you do.
Filters for Price, Amenities and Availability
Apply filters on the server. That's the rule everything else hangs on. When filtering happens server-side, your counts, clusters, and list always agree with what the map shows. Filter on the client after fetching and you'll ship a cluster count that includes homes the list then hides.
Parameters and Edge Cases
| Filter | Parameter shape | Edge case |
|---|---|---|
| Price range | Minimum and maximum in one currency | Open-ended maximum sent as absent, not as a large number |
| Bedrooms and bathrooms | Integer minimums | Studios need an explicit zero rule |
| Amenities | List of tags with AND or OR logic | Logic must be stated in the interface |
| Availability | Date window plus status field | Stale listings should be excluded when the filter is on |
| Property type | Canonical enumerated values | Market taxonomies differ and need mapping |
Price takes a minimum and maximum in one currency per market. Send an open-ended maximum as absent rather than as a huge number. A sentinel value leaks into sorts, analytics, and eventually a user's saved search, where it reads as a real ceiling.
Bedrooms and bathrooms take integer minimums. Decide what zero means for studios and write it down, because one provider's studio is another provider's one-bedroom with a combined living space. Amenities arrive as a list of tags, often from a dedicated source such as the Redfin amenities endpoint, and you must decide whether that list means AND or OR. A user who ticks parking and a garden probably wants both. State the choice in the interface instead of letting them infer it from shrinking results.
Availability uses a date window plus a status field. Stale listings generate more complaints than any other filter failure, so when the availability filter is on, exclude listings with no recent status update. Property type needs a canonical taxonomy. Local labels differ between markets, so map them to one value set at ingestion rather than translating in the UI for every market you add.
Handle missing fields with one consistent rule. A listing with no bedroom count gets excluded only when the bedroom filter is set, not by default. Excluding it always punishes incomplete data. Including it under an active filter breaks the filter's promise.
Interface habit: Show the result count next to the filter panel and update it from the same server response that draws the pins. If a filter can't run on the server, show a notice before the count changes, not after a user notices the mismatch.
Mobile and Desktop Map Patterns That Work for Everyone
Mobile gets a map with a sheet over it. Desktop gets a map beside a list. The results underneath should be identical.
This layout shows how the same search presents across a phone and a laptop.
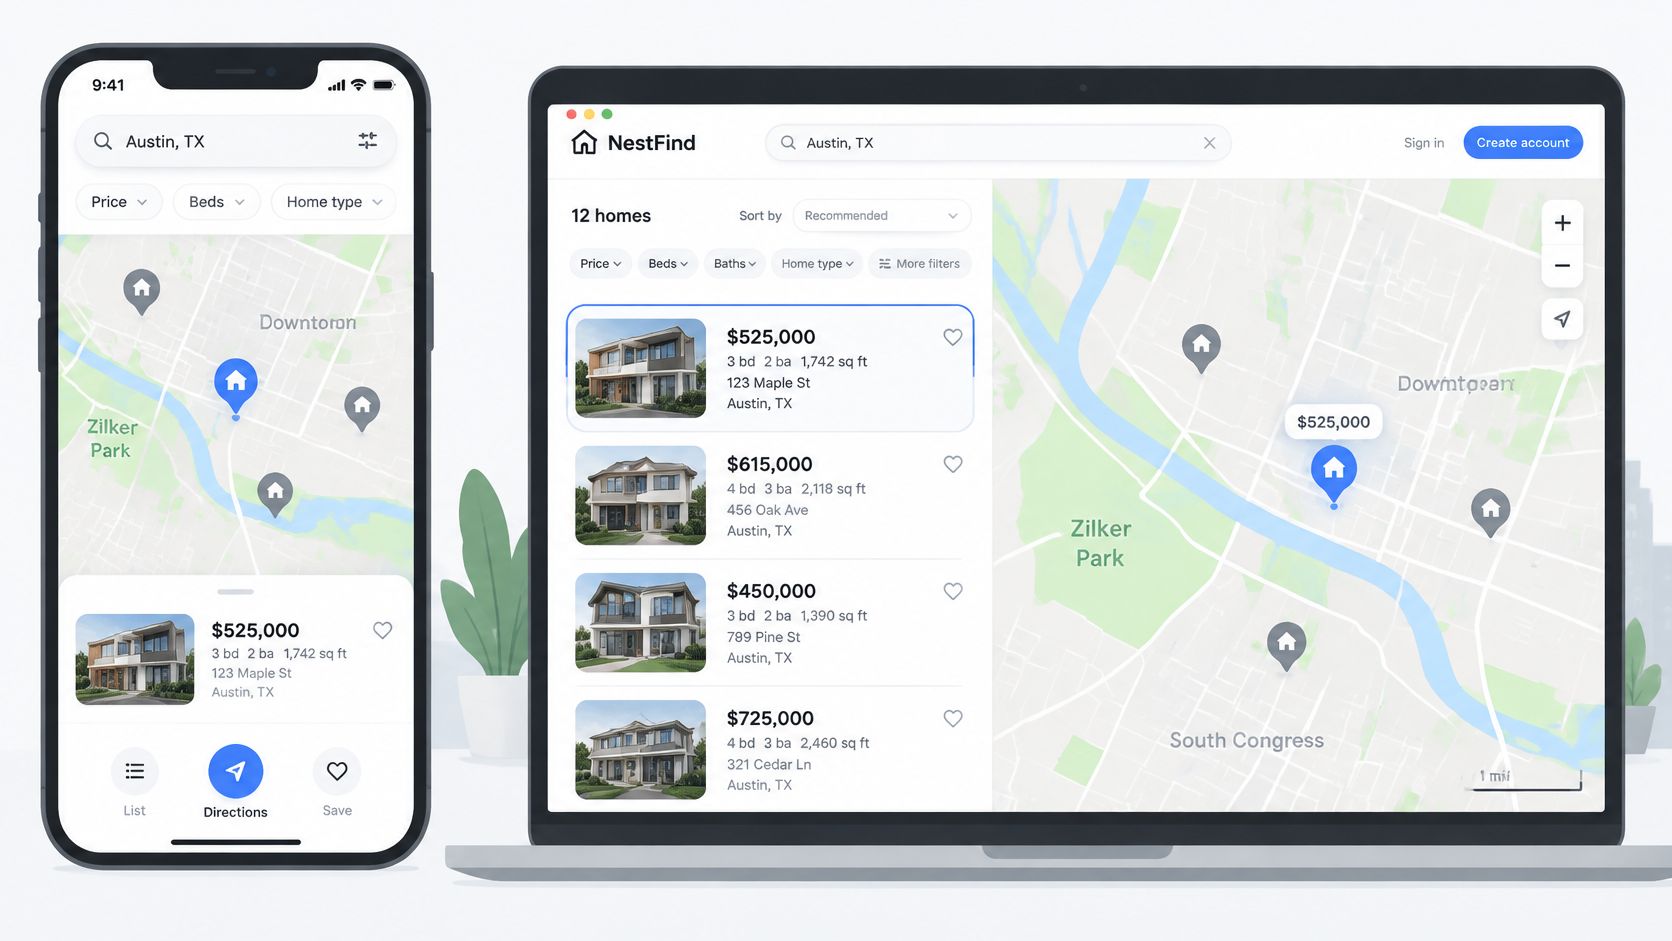
On mobile, use a bottom sheet with a draggable list above the map, tap targets of about 44 pixels, and one primary button labelled to re-search the visible area. On desktop, use a split view with a scrollable list on one side, and highlight a pin when its card is hovered. Re-query only after the map stops moving, with a short debounce of roughly 300 milliseconds, rather than firing on every frame of a pan.
If you're validating these patterns with real users, user research for mobile app design from Arch is a useful reference for structuring sessions before you commit to a layout. Keep filters and sort order identical in list and map modes. Switching views should never change the result set, only its presentation.
This walkthrough shows map search interaction patterns in a working property interface.
Accessibility as Part of the Search Model
A map that can only be panned by dragging leaves keyboard and switch users stuck. Provide zoom buttons, arrow-key panning, and keyboard-reachable pins. Return an ordered list alongside the geometry, since screen-reader users often need structured results with textual context, such as distance to a landmark or the neighborhood a home sits in, rather than a visual canvas.
Offer non-drag controls and saved areas for users with motor or cognitive disabilities. A saved area someone can re-run with one action beats a polygon they have to redraw every visit. Polygon search should also accept coordinates or a named place, not only a drawn shape.
I'd test one full search with only the keyboard and one with a screen reader before release. If either path can't reach a listing that the mouse path reaches, you haven't built one search with two interfaces. You've built two searches, and one of them is worse.
Confirm Your Stack and Run the First Map Query
A familiar city is a useful first test, but matching the map boundary is only part of the check. Confirm that coordinates land in the right place and that the returned listings make sense against their source pages.
RealtyAPI.io provides one API for property, rental, and market data from 27 listing platforms, including Redfin, Realtor, Airbnb, Rightmove, Zoopla, and Idealista. It supports searches by destination, coordinates, place ID, or URL. Get an API key, then use the API playground to try a search before integrating it.
- Choose an input that matches your test. Search by coordinates to test a map location, or use a destination, place ID, or URL when that better reflects how users will search.
- Check coordinate order and placement. Confirm the returned properties appear in the intended area. Swapped latitude and longitude can put a valid listing far from the expected map view.
- Inspect three listings. Compare their coordinates, price, and availability with the corresponding source pages.
- Record the request details. Log the input type and search parameters so you can trace results that later appear misplaced or missing.
RealtyAPI.io sends requests with the API key in the x-realtyapi-key header. Its data comes from publicly available information, and accuracy, completeness, and timeliness are not guaranteed. Verify results for your use case before relying on them. If the initial search checks out, start building on it at RealtyAPI.io.