Real Estate Price Appreciation: A Practical Guide

You're comparing two homes on the same street. One costs 8% more than a similar property did a year ago, and the seller says the neighborhood is “taking off.” You're left with the question that matters more than the headline: does that higher price reflect durable value, or a temporary spike?
Real estate price appreciation describes how property values change over time, but the phrase hides several separate questions. Are prices rising after inflation? Are comparable homes actually becoming more valuable, or has the mix of sales changed? Is the gain visible across the whole city, or only in a few neighborhoods and price tiers?
Those distinctions matter to homeowners, investors, lenders, analysts, and developers building market tools. A purchase can build equity over a long holding period, merely preserve purchasing power, or become an expensive bet on a local trend that fades. The most useful analysis combines historical context with current financing conditions, supply constraints, comparable listings, and live market signals.
Why Appreciation Matters When You Buy a Home
A renovated home sells for more than similar properties nearby. Before treating that premium as lasting appreciation, ask what supports it. Better construction, a stronger location, limited inventory, or a short burst of buyer competition can produce very different outcomes.
Appreciation affects the financial result of ownership through the purchase price, eventual sale price, financing costs, maintenance, taxes, and the opportunity cost of tying up capital in one property. A rising value can strengthen a homeowner's balance sheet. In a flat market, equity may come mainly from paying down the mortgage.
Holding period changes the meaning of a gain
A price increase over a few months is useful evidence, but it does not establish a durable trend. Buyers planning to hold for several years should examine the market's demand base, incoming supply, household incomes, rents, and land constraints. These factors help distinguish broad support from temporary enthusiasm.
Long-run research covering 14 advanced economies from 1870 to 2012 found that real house prices stayed broadly flat until World War II and then rose sharply after the war. Real house prices had increased about threefold since 1900, with most growth occurring in the second half of the twentieth century. Prices rose in every economy in the sample, as discussed in the cross-country research from Banca d'Italia cited in the history section.
That record provides context, not a guarantee for a particular suburb. A national trend can also conceal important differences between neighborhoods, property types, and price bands. Live listing data and market-signal APIs make it possible to check whether comparable homes in a small area are attracting stronger prices, selling faster, or shifting in composition.
Practical rule: A rising price records recent market behavior. It does not prove that the next buyer will pay more.
Appreciation affects owners and investors differently
For an owner-occupier, appreciation can raise net worth and create flexibility when refinancing, moving, or selling. An investor must also account for rental income, operating costs, vacancies, taxes, insurance, and the purchase price relative to expected cash flow.
The useful question is not only whether prices rose. It is whether this property gained enough value to justify the risks and costs of owning it. That requires comparing like with like, checking inflation and holding periods, and watching local signals rather than relying only on national headlines. The sections that follow examine the definitions, measurement methods, market drivers, historical context, and data tools behind that analysis.
What Real Estate Price Appreciation Actually Means
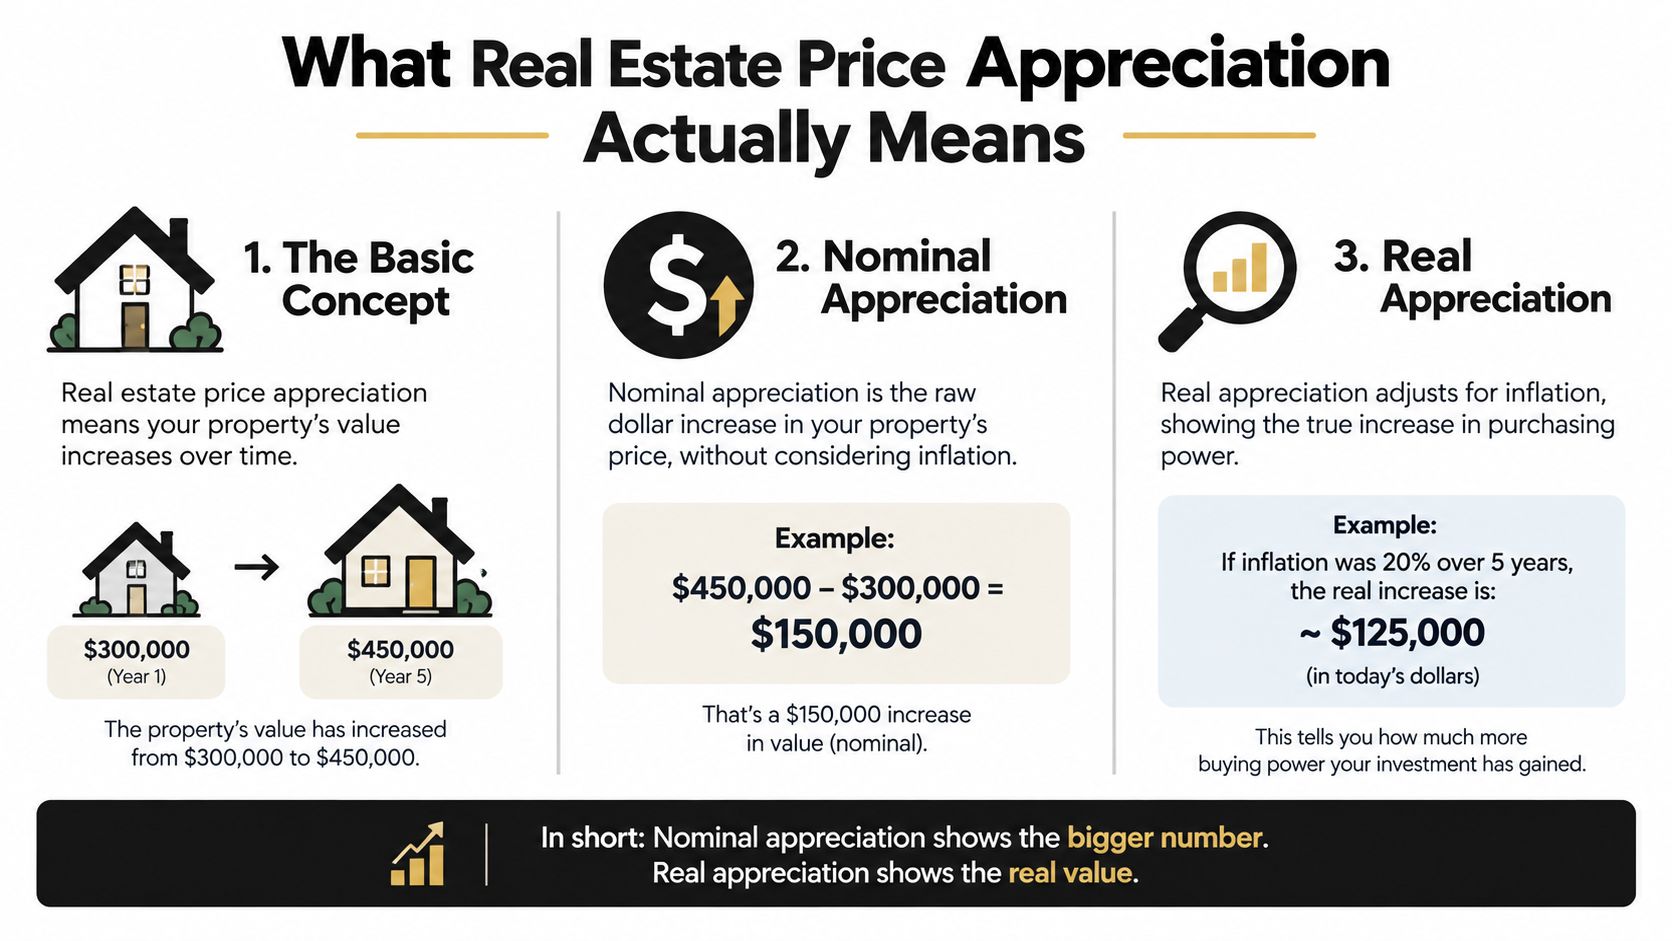
Start with the simplest definition: appreciation occurs when a property is worth more today than it was previously. If a home's market value rises from its purchase price, the property has experienced nominal appreciation. If the value falls, the property has experienced depreciation.
Step one, separate dollars from purchasing power
Nominal appreciation uses the raw change in price. Imagine buying a home for $400,000 and selling it for $460,000 after five years. The dollar gain is $60,000, and the nominal gain is 15%.
Real appreciation asks a different question: how much did the property gain after accounting for inflation? If consumer prices rose 20% during the same period, a home would need to rise by more than 20% to preserve its purchasing power. In this example, the inflation-adjusted change is approximately negative 4.2%, because the home's 15% nominal increase lagged the 20% rise in consumer prices.
The calculation is:
- Nominal gain: ($460,000 − $400,000) ÷ $400,000 = 15%
- Real gain: (1.15 ÷ 1.20) − 1 ≈ −4.2%
This distinction matters because a property can look more valuable in dollars while becoming less valuable in real terms.
Step two, distinguish price from equity
Appreciation isn't the same as the equity you can access. Home equity equals the current market value minus the outstanding mortgage balance and other liens, as explained in this home equity definition for homeowners.
Equity usually grows through two channels: the property's market value rises, and the borrower pays down principal through amortization. A home can therefore build equity even during a period of modest appreciation, provided the mortgage balance is declining.
Step three, account for taxes and selling costs
A price increase isn't the same as profit. Sellers may pay commissions, transfer taxes, legal fees, repairs, and other transaction costs. Eligible U.S. homeowners may exclude up to $250,000 of gain from income, or up to $500,000 for married couples filing jointly, under Internal Revenue Code Section 121, subject to the ownership and use requirements described by the IRS in Publication 523.
A clean analysis labels each figure clearly: nominal price change, real price change, equity change, and net proceeds after costs.
How Appreciation Is Measured and Compared
Analysts can describe the same market in several valid ways. The method you choose determines which question you can answer and which details may disappear.
Three common measures
Year-over-year change compares a current reading with the same period in the prior year. It's useful for identifying momentum and turning points, but it can be distorted by the comparison base, seasonal patterns, and unusual activity in the earlier period.
Compound annual growth rate, or CAGR, converts the total change over a holding period into a smoothed annual rate:
CAGR = (ending value ÷ beginning value)^(1 ÷ years) − 1
CAGR helps compare properties or markets held for different periods. It shouldn't be mistaken for the path prices followed, because a smooth annual rate can conceal a boom, correction, and recovery.
Index-based measurement sets a base period to 100 and expresses later values relative to that starting point. Repeat-sale indexes such as those produced by Case-Shiller and FHFA aim to track price movement while reducing the distortion caused by changes in the types of homes sold.
| Method | Formula Sketch | Best Used For | Key Limitation |
|---|---|---|---|
| Year-over-year change | Current value ÷ prior-year value − 1 | Spotting recent momentum | Sensitive to base effects and seasonality |
| CAGR | (Ending ÷ beginning)^(1 ÷ years) − 1 | Comparing holding periods | Hides the path between endpoints |
| Price index | Base period = 100, later values relative to base | Tracking long cycles | Weighting and methodology affect interpretation |
What the headline can hide
A median sale price may rise because buyers purchased more expensive homes, not because comparable homes appreciated by the same amount. New construction, neighborhood mix, property size, and changes in the types of buyers active in the market can all move the median.
For that reason, analysts often compare a median series with a repeat-sales index, inventory data, and segment-level results. A useful API workflow can also track the same geography and property type repeatedly. For example, a Zestimate percent-change endpoint can support a broader monitoring process when paired with consistent dates, comparable properties, and a clear definition of the metric being measured.
The strongest conclusion usually comes from agreement among several measures. If a repeat-sale index, comparable listing prices, pending sales, and local inventory all point in the same direction, the signal deserves more attention than a single changing median.
What Drives Appreciation Across Markets and Segments
Appreciation begins with demand meeting supply, but that simple relationship produces very different results from one market to another. Mortgage rates affect the buyer's monthly payment, household formation creates demand, inflation can raise building and borrowing costs, and land-use rules determine how quickly builders can add homes.
The same macro shock can produce different local outcomes
A rate increase may sharply reduce purchasing power for highly indebted buyers, while having less effect in a market where cash buyers represent a larger share of transactions. A suburb with a large construction pipeline may absorb new demand through additional homes. A supply-constrained coastal market may have fewer units available, so competition can show up more directly in prices.
Inflation can also push housing costs higher by increasing construction expenses and borrowing costs. The resulting pressure may discourage new supply and widen the gap between home prices and household income, a relationship discussed in this overview of factors affecting the real estate market.
| Driver | Rate-Sensitive Metro | Cash-Heavy Metro | Supply-Rich Sun Belt | Supply-Starved Coastal |
|---|---|---|---|---|
| Mortgage rates | Payment shock can reduce demand quickly | Cash buyers may cushion the effect | Financing still shapes buyer budgets | Limited supply can preserve competition |
| New construction | Pipeline determines future inventory | Luxury development may matter more | New units can moderate price growth | Building constraints limit response |
| Household growth | Job creation must support payments | Migration can support higher prices | In-migration may meet new supply | Existing demand competes for scarce homes |
| Inflation | Raises financing and replacement costs | Can support real-asset demand | Raises construction costs | Can reinforce scarcity if building slows |
Segment differences matter
Entry-level homes may attract a deeper pool of financed buyers than luxury properties. During a period of tighter credit, higher-priced segments can lose marginal buyers more quickly, while affordable homes remain competitive if supply is limited. That doesn't mean entry-level property always appreciates faster. It means the demand pool and financing exposure differ by segment.
Local analysis should therefore separate price tiers, bedroom counts, property types, and neighborhoods. A citywide figure can hide a strong result for smaller homes beside stagnation in new luxury construction.
A national average describes the market's center of gravity. It doesn't tell you where the next transaction is likely to clear.
Readers who want broader context on underwriting and market selection can also consult New American Funding real estate investing resources. For repeatable local comparisons, a Redfin housing market trends endpoint can help organize market indicators by geography rather than treating a country or state as one uniform market.
A Brief History of Appreciation and Recent Cycles
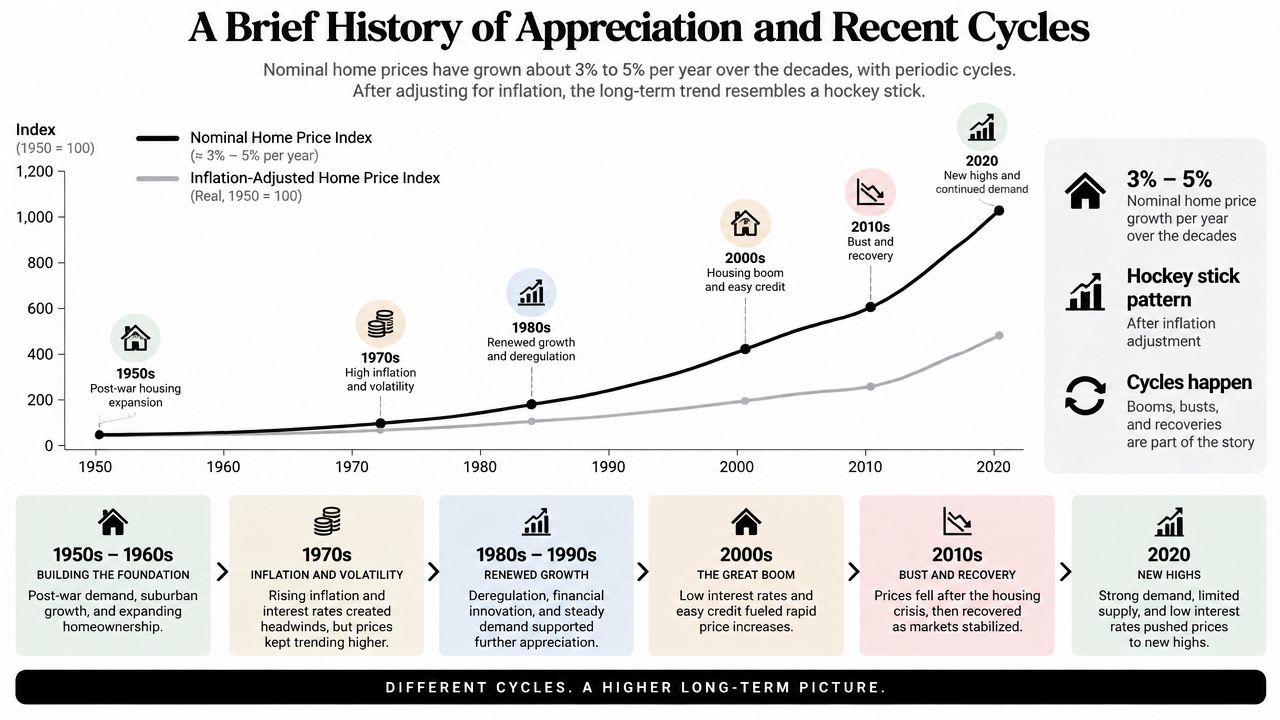
Long-run housing data show why appreciation can look steady from a distance while feeling uneven to individual owners. Cross-country research found broadly flat real house prices from the late nineteenth century until World War II, followed by sharp postwar gains. As noted earlier, the postwar rise provides the baseline. The more useful question here is how later cycles diverged from it (historical housing price dataset).
Housing markets do not move upward in a straight line. Regional booms can be followed by financing shocks, construction surges, employment changes, or corrections. A long-term index may rise while a particular neighborhood spends years near its previous peak or falls in real terms after inflation.
Recent data show dispersion, not one global path
The Bank for International Settlements reported that global real house prices remained about 20% above their levels at the end of the 2007 to 2009 Global Financial Crisis. Since the end of 2019, they had increased by almost 3% during the period covered by the release. G20 results varied sharply: Türkiye recorded 109% growth, Australia and Mexico each recorded 22% growth, while China declined 20% and Canada declined 7% (BIS residential property price commentary).
The comparison shows why national headlines can miss smaller markets. Interest rates, construction, jobs, migration, and local supply can push a metro or neighborhood in a different direction from its country.
For a place-specific comparison, investment tips for Dublin housing offers local framing. Live listing feeds and market-signal APIs can then show whether asking prices, available homes, and buyer activity are changing in the specific micro-market under review. The aim is to explain a market's path, not copy a national average into a local decision.
Forecasting and the Metrics Worth Monitoring
Forecasting appreciation isn't about producing one precise number. It's about building a dashboard that separates early signals from measures that confirm what already happened.
Read indicators by timing
Leading indicators include building permits, mortgage applications, mortgage-rate movements, and changes in asking prices. They can show a shift in buyer capacity or future supply before closed-sale data records it.
Coincident indicators include closed prices, inventory turnover, days on market, and the list-to-sale price ratio. These describe current conditions, though closing data often reflects contracts agreed earlier.
Lagging indicators include delinquencies and distressed sales. They can confirm stress after it has already affected borrowers and transactions.
| Category | Metric | What It Signals | Source Example |
|---|---|---|---|
| Price | Median and repeat-sale index | Direction of observed values | FHFA or Case-Shiller |
| Supply | Months of supply and active inventory | Competition versus available homes | Listing databases |
| Demand | Pending and closed sales | Buyer activity now and later | Brokerage and public records |
| Financing | Mortgage-rate trajectory | Changes in purchasing power | Mortgage-market data |
| Development | Permits and builder sentiment | Future housing pipeline | Local records and NAHB |
| Income and rent | Rents and rental yields | Support for prices and investor returns | Rental and listing data |
The Federal Reserve Bank of Dallas found in a 384-metro U.S. panel covering Q1 1975 through Q2 2023 that a 100-basis-point increase in 30-year fixed mortgage rates was associated with an expected 1.6% decline in house prices over the following year. The effect was larger where supply was constrained (Dallas Fed analysis). An FHFA working paper also estimated long-run mortgage-rate elasticities of roughly -0.2 to -0.8 across the 100 largest U.S. cities, with the adjustment influenced by borrower debt-service constraints (FHFA working paper).
Combine signals instead of chasing one
A falling months-of-supply figure is more persuasive when pending sales are rising, rates are stable, and days on market are shortening. A price increase paired with swelling inventory and weaker pending contracts deserves caution.
A practical review cadence looks like this:
- Monthly: Check new listings, pending sales, price reductions, inventory, and rate changes.
- Quarterly: Compare repeat-sale indexes, metro performance, price tiers, and local supply.
- Annually: Reassess employment, migration, construction capacity, rents, taxes, and land-use conditions.
A market-monitoring resource such as the ReloMaps blog can add geographic perspective, but the underlying rule remains simple: use several indicators, keep the geography consistent, and record what changed between observations. For automated valuation and trend work, a Zillow housing market ZHVI endpoint can be one input in a wider data pipeline.
Using RealtyAPI Market Signals and Listing Data
A market index tells you how a defined basket moved. Listing data helps explain what is moving inside that basket. Combining the two lets an analyst ask more precise questions, such as whether three-bedroom homes in one suburb are appreciating faster than the citywide median.
Start with a consistent market snapshot
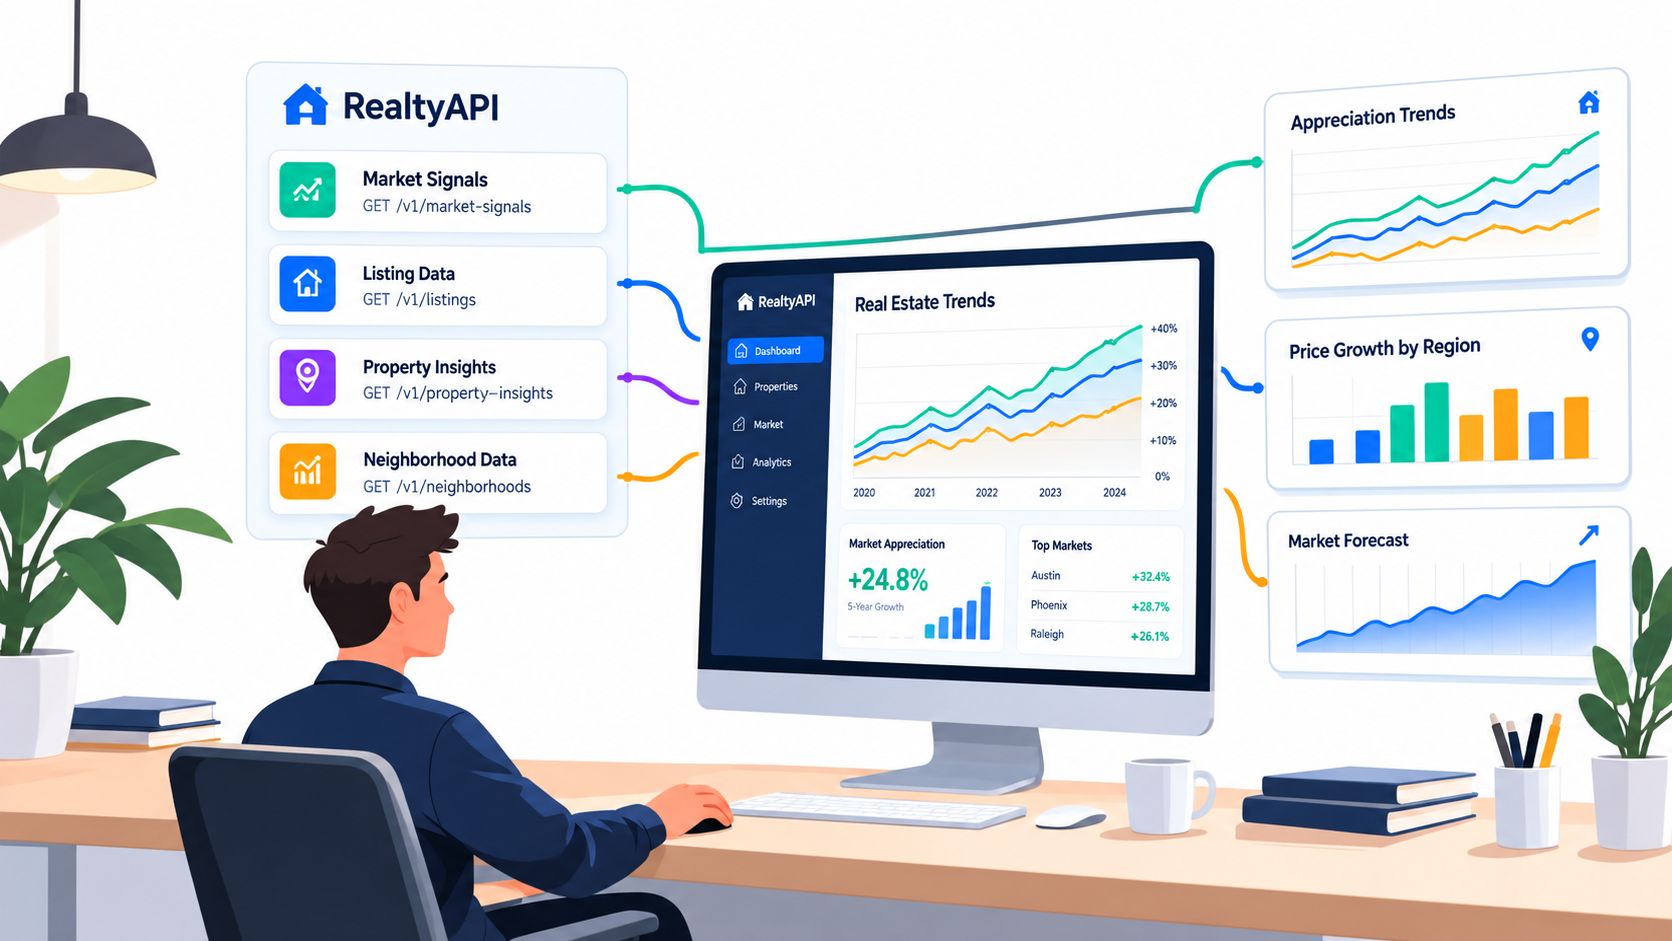
Use the Market Signals endpoint with a fixed geography, such as a ZIP code, city, or metro. Capture the same fields each time:
- Median list price, to track seller expectations.
- Median sale price, to observe completed transactions.
- Days on market, to measure the pace of absorption.
- Inventory, to estimate how much choice buyers have.
Pull the snapshot at regular intervals and compare like with like. If list prices rise but sale prices remain flat, sellers may be testing the market rather than achieving higher values. If the list-to-sale relationship tightens while inventory falls, buyer competition may be strengthening before a slower official index reflects the change.
Validate the median with individual listings
The Listings endpoint adds the raw observations behind the summary. Query comparable homes using consistent property type, bedroom count, geography, and time window. Then inspect whether the apparent price movement comes from genuine changes among similar properties or from a shift toward larger, newer, or more expensive listings.
For example, an analyst could request three-bedroom single-family listings in a target suburb over the last quarter, sort the results by price change, and group them by neighborhood or ZIP code. That view can reveal a small pocket where asking prices and completed sales are accelerating, even while the broader metro appears flat.
Turn observations into a repeatable process
A useful pipeline stores each snapshot with its retrieval date, geography, property filters, and metric definitions. That makes later comparisons auditable and prevents a change in query criteria from appearing as appreciation.
Developers can review RealtyAPI integration documentation when connecting market signals and listing workflows to their own applications. RealtyAPI.io provides public listing, pricing-trend, and market-signal data through a unified API, allowing teams to query properties and market conditions by destinations, coordinates, place IDs, or URLs. It can fit alongside official indexes, public records, and internal underwriting models rather than replacing them.
RealtyAPI.io can help you turn real estate price appreciation from a vague headline into a monitored set of local signals, comparable listings, and repeatable queries. Visit RealtyAPI.io to explore the API and build a market-tracking workflow for the geographies and property segments that matter to you.