Real Estate Market Massachusetts Data

The most popular advice about the real estate market in Massachusetts is also the least useful for product teams: watch the statewide median, decide whether the market favors buyers or sellers, and build from there. That approach compresses incompatible markets into one headline. It hides the difference between an owner-occupied house, a renter-heavy multifamily building, a seasonal property, and a newly completed unit that hasn't yet reached effective inventory.
A more reliable view treats Massachusetts as a liquidity and affordability system. Transaction volume, listing flow, tenure, occupancy, construction status, local prices, rents, and household purchasing power must be analyzed together. For PropTech builders, the central question isn't whether prices are rising. It's whether people can transact, where inventory is becoming usable, and which apparent improvements represent genuine supply rather than repricing.
The Myth of a Single Massachusetts Housing Market
A statewide median can be mathematically accurate and operationally misleading. Massachusetts contains more than 3 million homes, with approximately 57% classified as single-family properties and the remainder in buildings with two or more units, according to the Massachusetts housing supply and production data. Those structures serve different users and generate different signals. About 90% of single-family homes are owner-occupied, while roughly 75% of multifamily units are renter-occupied, so a single price series combines very different tenure economies.
Seasonality creates another distortion. Statewide, 3.6% of homes serve as seasonal residences or short-term rentals, but the share reaches 36% on Cape Cod, 13% in the Berkshires, and 60% on Nantucket and Martha's Vineyard. A listing feed that treats every dwelling as equivalent year-round supply will overstate availability in precisely the places where seasonal demand has the strongest effect.
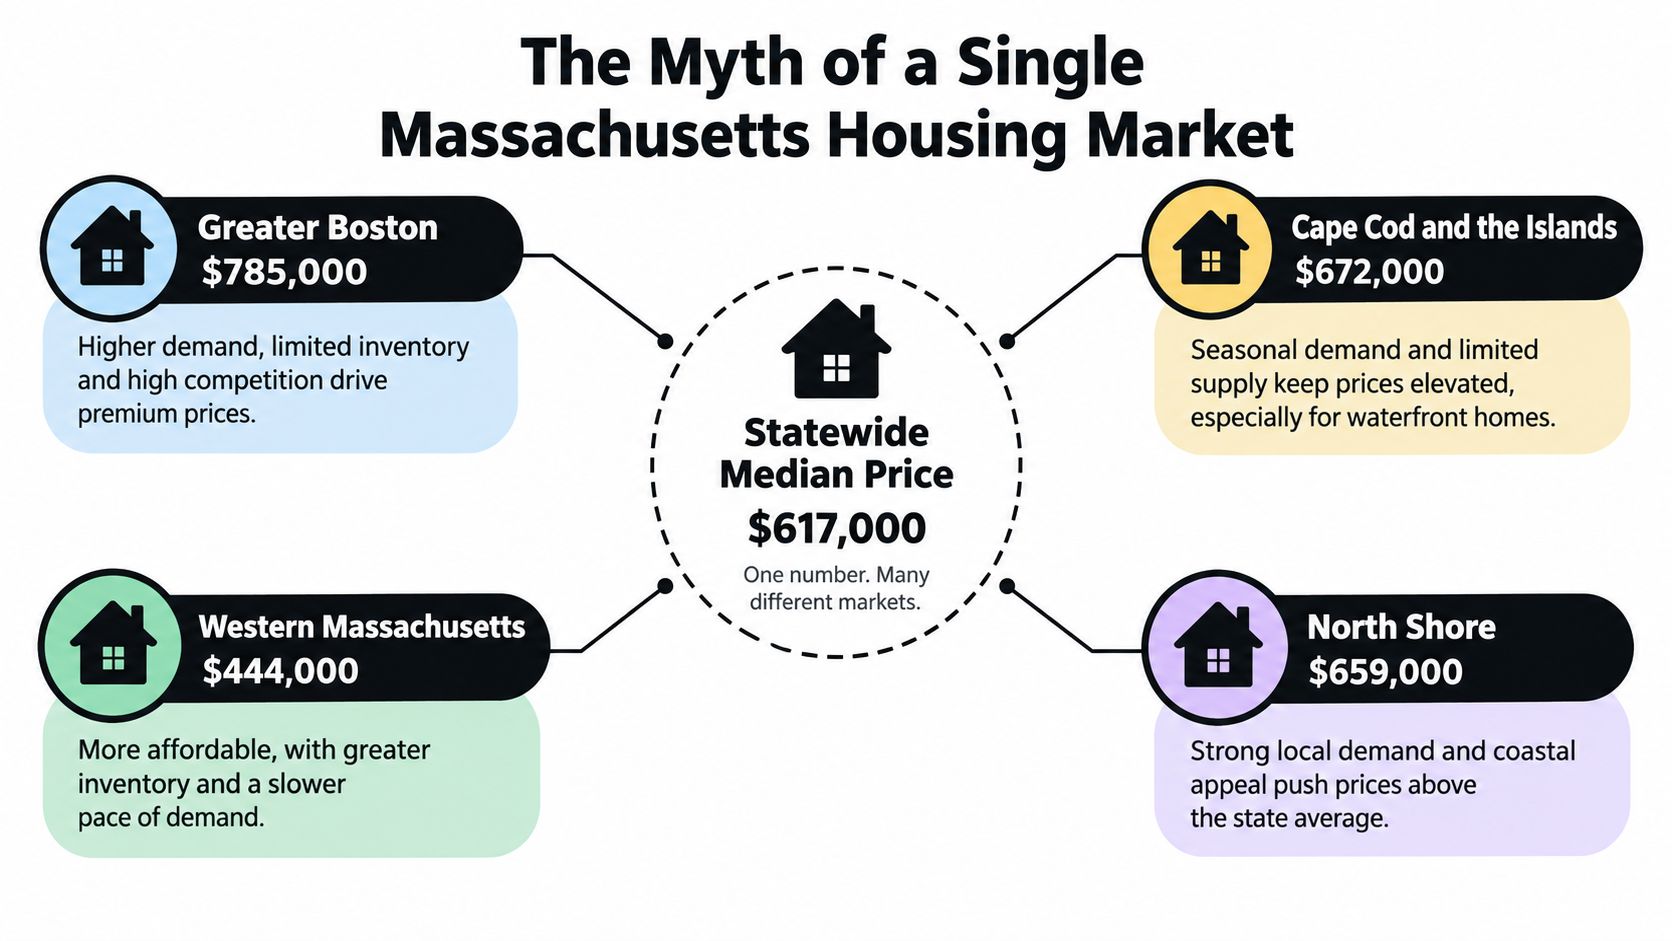
Why aggregation breaks product decisions
The statewide data also points to constrained availability. Massachusetts reports that only 1.6% of homes are available for sale or rent, described as a historically low vacancy rate, while annual housing production averaged 19,000 units from 2010 through 2020 and only 11,600 homes received building permits in 2023. These measures describe a structural shortage, but they don't tell a buyer whether a particular municipality has usable inventory or a developer whether a project is likely to reach occupancy.
A better application separates at least four dimensions:
- Structure: single-family, condominium, and multifamily properties should have distinct filters and comparison sets.
- Tenure: owner occupancy and renter occupancy change how users interpret pricing, demand, and turnover.
- Availability: active, pending, withdrawn, relisted, seasonal, and short-term properties shouldn't share one inventory count.
- Geography: municipality, county, neighborhood, and coastal or inland classification provide more decision value than a statewide label.
For teams benchmarking regional behavior, a broader comparison such as PropLab's market outlook can be useful as a reminder that housing analytics must preserve local market context rather than flattening every geography into one national template. Massachusetts requires that discipline inside the state itself.
Analyzing 2026 Transaction Volume and Price Trends
The key signal in early 2026 isn't a simple rise or fall. It's the divergence between completed transactions and sale prices. Massachusetts recorded 2,305 single-family home sales in January 2026, down 12.7% from 2,639 sales in January 2025, while the median single-family sale price rose 4.7% year over year to $612,500, according to The Warren Group's January market release.
That combination usually deserves a different interpretation from “demand is booming.” Fewer completed sales mean fewer households are clearing the financing, inventory, and pricing hurdles required to close. Higher prices indicate that the available homes still attract enough qualified demand to prevent broad discounting. For an analyst, this looks more like supply-constrained liquidity than an unrestricted expansion in market activity.
The annual baseline adds useful context. The Warren Group reported 43,240 single-family sales statewide in 2025, up 3% from 42,138 in 2024, while the 2025 median sale price reached $638,000, a 3.7% year-over-year increase, as reported by The Boston Globe's Massachusetts home-sales coverage. The recovery in volume didn't remove pricing pressure. It showed that more transactions can occur while affordability and inventory remain restrictive.
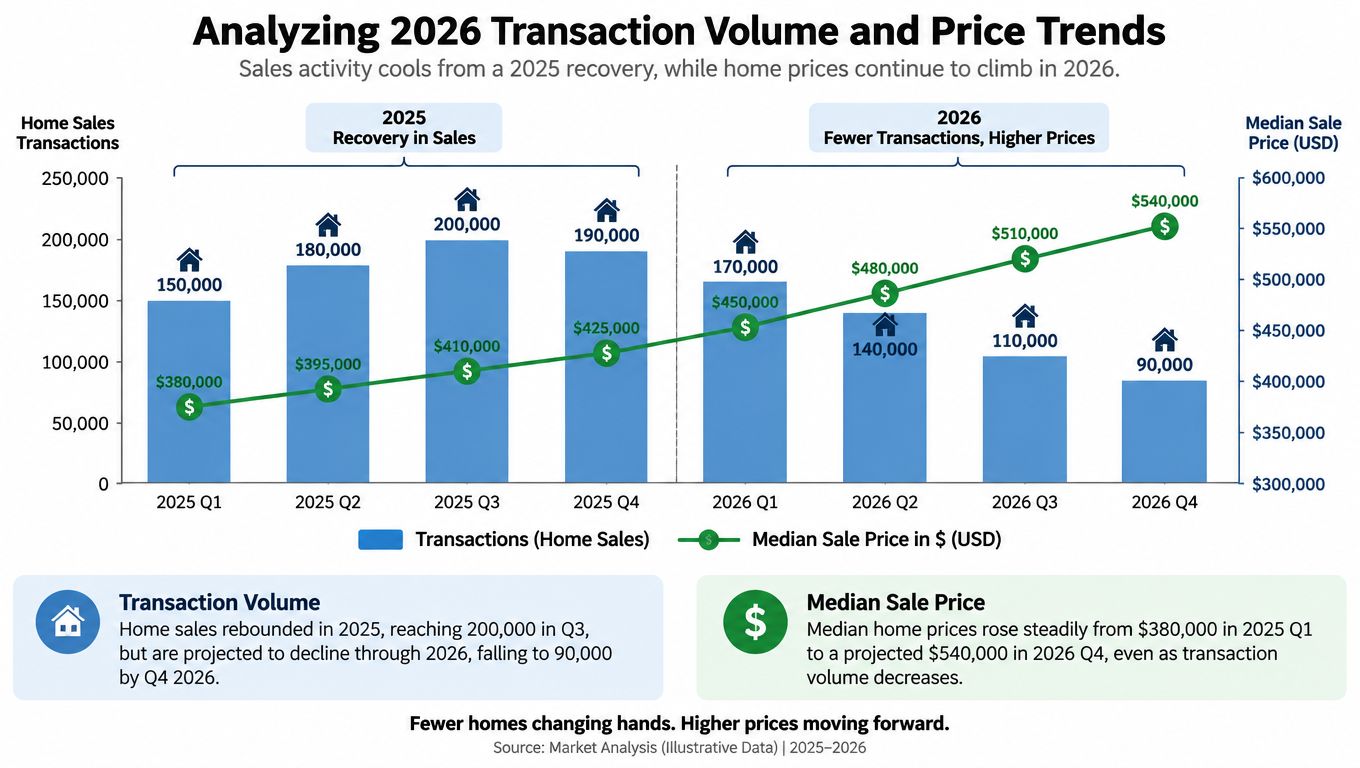
The asset-class split matters
A monthly statewide trend can also conceal different behavior by property type. In June 2026, the median single-family price was $715,000, down 1.4% from $725,000 one year earlier, while the median condominium price rose 1.7% to $590,000 from $580,000. Closed single-family sales increased 7.0%, and condominium closings increased 9.1%, according to WGBH's spring housing-market report.
A pricing model should therefore avoid using one statewide target variable. It should preserve property type, sale date, location, and transaction status, then compare price movement against the relevant peer group. A condo dashboard that reports rising prices alongside stronger closings may describe a different liquidity regime from a single-family dashboard showing price softness.
For application teams, historical price data should be paired with listing and transaction events. A price-history API can support time-series features, but the useful product layer is the interpretation: distinguish a price increase caused by changing property mix from one caused by genuine repricing, and distinguish fewer closings from weaker buyer interest when inventory is also contracting.
Regional Market Divergence Across Key Counties
County data makes the statewide contradiction visible. Essex County recorded 324 single-family homes in inventory in January 2026, down 21.7% year over year, while closed sales declined 11.2% to 223 and the median sale price increased 2.8% to $713,000, according to the January 2026 Massachusetts county market report. Inventory fell faster than sales, so the county had fewer opportunities to transact even as prices remained firm.
Middlesex presents a different scale and price profile. It recorded 398 closed sales, down 7.9%, with a median price of $837,500. Norfolk County posted 223 sales, down 14.2%, while its median price rose 7.5% to $805,000. These aren't interchangeable versions of the same market. They show why a buyer-facing product should return localized liquidity indicators rather than a generic Massachusetts label.
| County | Closed Sales | YoY Sales Change | Median Price | YoY Price Change |
|---|---|---|---|---|
| Essex | 223 | -11.2% | $713,000 | +2.8% |
| Middlesex | 398 | -7.9% | $837,500 | Not reported |
| Norfolk | 223 | -14.2% | $805,000 | +7.5% |
Build the county view around inventory behavior
The critical metric isn't only how many properties sold. It's how many remained available, how quickly they moved, and whether sellers changed prices before going pending. In Essex, the inventory contraction suggests that a lower sales count cannot be read as weak demand without examining the reduced opportunity set. In Middlesex, the higher median price and larger transaction base require a separate comparable set, especially for neighborhood, property type, and commuting characteristics.
A useful regional search API should feed a data model that retains municipality and county identifiers, listing status, property type, price history, and event timestamps. The application can then calculate absorption at neighborhood level, flag stale listings, and compare new listing flow with pending activity.
Practical rule: Treat inventory contraction and sales contraction as separate events. When both occur together, the product should show users that fewer sales may reflect fewer available properties rather than a broad collapse in demand.
This approach also matters outside the major Boston-area counties. Western Massachusetts, the North Shore, and seasonal coastal communities can have distinct listing depth and occupancy patterns. A geospatial feed that lets users compare local supply, price changes, and property type will produce a more truthful market picture than a single state filter.
The Hidden Affordability Crisis and Entry Barriers
A median price answers what a typical completed transaction cost. It doesn't answer whether an ordinary household can enter the market. That requires a model of income, down payment, mortgage cost, taxes, insurance, maintenance, rent, and commuting expense.
Greater Boston shows the gap clearly. The income required for an entry-level home rose from approximately $98,000 in 2021 to more than $162,000 in 2025, assuming a 3.5% down payment, according to WBUR's affordability reporting. Boston-area rent was nearly $3,000 per month in September 2025, and more than half of renters were cost-burdened. The price series alone doesn't expose that entry barrier.
Replace the median with a budget surface
An affordability feature should show how a household's options change by location. The relevant output isn't “affordable” or “unaffordable.” It's a map of feasible choices, with purchase payments and rents compared against local wages and recurring costs.
A useful interface could let a user adjust:
- Income and cash: model the required income and available funds without assuming that the statewide median represents the user's target.
- Tenure choice: compare a purchase scenario with a rental scenario for the same municipality or neighborhood.
- Property category: separate condos, single-family homes, and multifamily opportunities because their prices and operating costs differ.
- Recurring expenses: include taxes, insurance, maintenance, and commuting costs in the monthly estimate.
- Location constraints: show how a lower listing price may interact with longer travel or fewer local employment options.
A localized affordability calculator becomes more valuable than a generic mortgage widget. It can connect live listings to budget thresholds, then expose the tradeoff between monthly payment and location rather than hiding the tradeoff behind one search result.
The same principle applies to renters. Boston-area cost burden means a household may qualify for a listing but lack financial resilience after paying rent and other obligations. A product that labels a property “within budget” without modeling that pressure can create false confidence. Affordability analytics should surface uncertainty and show the assumptions behind every result.
Tracking the Supply Pipeline and Construction Reality
Construction data needs state transitions, not a single project count. Massachusetts estimated that approximately 63,100 homes were completed and available for occupancy between January 2023 and July 2025, with another 18,300 units under construction. Including proposed and funded projects, about 90,400 homes had been completed, started, or proposed since the beginning of the Healey-Driscoll administration, according to the state's housing-production tracking data.
Those categories don't have equal market impact. Completed units can affect effective supply after occupancy. Under-construction units remain exposed to financing, labor, and delivery risk. Proposed units may never become available. A dashboard that adds all three categories together will present a pipeline total as though it were immediate inventory.
Design the pipeline as an event history
Massachusetts also reported approximately 14,338 permitted units in 2024, compared with an estimated 97,700 net increase in residential addresses since the 2020 Census. The difference demonstrates why permits alone can mismeasure delivered supply. A permit is an administrative event, while an address-level completion indicates that housing has moved closer to actual occupancy.
A production data model should preserve:
- Proposed projects, including the municipality, housing type, and proposed unit count.
- Permitted units, with permit date, status, and any available project identifiers.
- Units under construction, with the transition timestamp and current project state.
- Completed and available units, linked to addresses or geocoded parcels where possible.
For teams evaluating renovation or expansion opportunities, a separate resource on home addition pricing in MA can provide context for construction-cost inputs, although a market-supply system still needs its own project-status and occupancy records.
The product implication is direct. Geocode projects by municipality and housing type, timestamp every transition, and track the difference between announced capacity and delivered units. Investors can then estimate where supply may enter the market, while marketplaces can avoid presenting proposed housing as available inventory.
Architecting Real Estate Data Applications with APIs
A Massachusetts real estate application should begin with a data contract, not a dashboard. The contract defines the fields required for search, valuation, affordability, and event tracking, then specifies how the system handles missing values, changing listings, duplicate properties, and historical revisions.
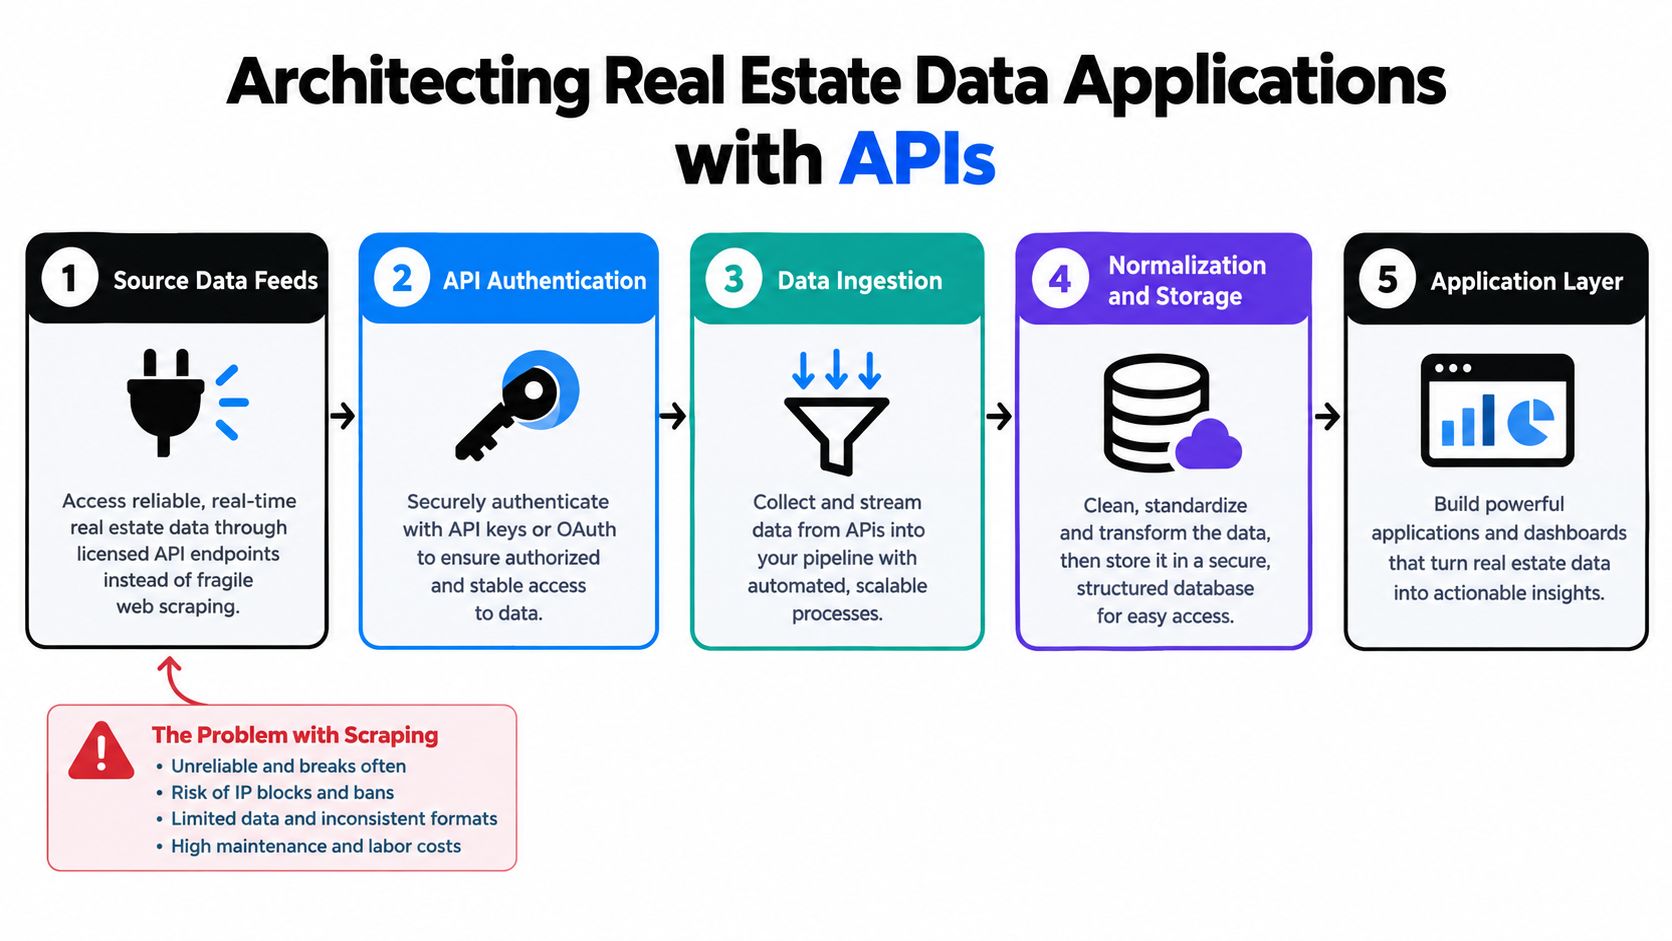
Use a layered ingestion design
A practical architecture separates source access from application logic:
- Source feeds: collect listing, property, pricing, rental, and location signals through permitted endpoints instead of building a brittle scraper for each site.
- Authentication: keep API credentials outside client applications and rotate them through a controlled server-side process.
- Ingestion: paginate through search results, record retrieval timestamps, and preserve the source response needed for auditability.
- Normalization: map different names and formats into a common property schema, then deduplicate using stable identifiers and address-level matching.
- Application layer: expose search, alerts, affordability comparisons, market dashboards, and investment analytics through services that read from the normalized store.
The RealtyAPI.io documentation describes a developer-facing path for accessing real estate data through API workflows. In a Massachusetts deployment, the team should still validate geographic coverage, source freshness, property-type mappings, and the treatment of historical listing events before using the data in a production metric.
Engineer for change, not just retrieval
Pagination matters because a county or statewide query can produce more results than one response can safely return. Store a cursor or page state, record the query parameters, and make ingestion idempotent so a retry doesn't create duplicate listings. For transient failures, use exponential backoff and preserve failed jobs for replay rather than dropping a municipality from the dataset.
GraphQL can reduce unnecessary payload when the application needs only selected attributes, such as asking price, coordinates, property type, status, and price history for an affordability view. REST endpoints can remain useful for broad extraction jobs, while webhooks or scheduled polling can support event-driven updates where available.
The normalized model should retain both current state and history. A property that changes from active to pending, returns to active, or receives a price cut can reveal more about liquidity than its current status alone. The system should also distinguish a new listing from a relisting, because counting both as fresh supply can exaggerate inventory improvement.
Data design principle: Every market metric should be reproducible from stored events. If a dashboard reports absorption or price-cut velocity, the underlying listing transitions and timestamps should be inspectable.
That audit trail supports analysts, product managers, and users. It also makes it easier to recalibrate models when a source changes its schema or when a municipality reports a delayed update.
Strategic KPIs for Market Monitoring and Product Growth
The right KPI set should detect liquidity changes before median prices fully reflect them. A statewide price trend is a lagging summary. Product teams need event-level indicators that explain why the summary moved.
Track these measures by county, municipality, neighborhood, property type, and price band:
- New-listing flow: count newly exposed properties separately from relistings and returned listings.
- Inventory duration: calculate how long the current stock would last at the prevailing sales pace, then compare the result across local markets.
- Absorption: measure pending and closed activity against available listings, with separate treatment for single-family, condo, and multifamily properties.
- Stale-listing velocity: identify how quickly listings pass through defined age bands without going pending.
- Price-cut ratio: compare listings with price reductions against new listings and pending sales to distinguish repricing from genuine inventory growth.
- Withdrawal and relisting rate: flag properties that leave the market without a recorded sale and later reappear.
- Affordability coverage: show the share of listings that fit a modeled household budget after purchase or rental costs, taxes, insurance, and commuting assumptions.
- Pipeline conversion: follow proposed, permitted, under-construction, and completed units as separate cohorts.
The July 2026 market report reinforces why inventory duration belongs in the core dashboard. Statewide inventory was down 6.8% year over year, and months of supply fell to 2.4 months, a 9.2% annual decline, according to the July 2026 Massachusetts market report. Months of supply measures how long current listing stock would last at the prevailing sales pace if no additional homes entered the market. It explains how prices can stay high while transaction volume remains weak.
A strong product doesn't merely publish these KPIs. It lets users move from a state view to a county, neighborhood, property type, and individual listing event. That path turns raw API responses into an explanation of market mechanics, which is what investors, brokerages, and marketplace operators need to make decisions.
RealtyAPI.io provides a unified, developer-first data layer for public real estate listings, pricing trends, and live market signals, with REST, GraphQL, and webhooks for production applications. Visit RealtyAPI.io to evaluate how its data access can support Massachusetts listing search, affordability products, and event-level liquidity monitoring.