Real Estate Analytics Platform Guide

Most advice about choosing a real estate analytics platform starts with the dashboard. That's backwards. Charts are the visible layer, but the expensive work happens underneath, where teams reconcile listing identities, interpret local status codes, align timestamps, and decide whether two apparently similar prices are actually comparable. More sources don't automatically create better intelligence. Without disciplined normalization, they create a larger and more convincing version of the same data problem.
A production-grade platform should help developers and analysts answer a harder question than “What's the current median price?” It should show where a metric came from, when it was refreshed, how it was transformed, and how much confidence the user should place in it. That standard matters for a marketplace, an investment model, a short-term rental workflow, and any application where a stale or duplicated listing can trigger a bad decision.
The Hidden Cost of Fragmented Property Data
The common assumption is simple: connect more listing sources, collect more records, and the analytics will improve. In practice, each source introduces a new interpretation of property type, availability, geography, currency, price, and time. A listing marked active in one market may include a property that another source labels available, while a pending record may be excluded entirely elsewhere.
That inconsistency breaks downstream logic. A supply dashboard can overstate inventory when the same home appears under several URLs. A pricing model can mistake a change in currency for a local market movement. An occupancy calculation can compare a short-term rental calendar with a long-term listing feed without recognizing that the two systems describe different kinds of availability.
Why coverage can reduce quality
Data fragmentation is identified as the top barrier to AI adoption in commercial real estate in a 2026 assessment covering approximately 2,500 global technology decision-makers. The assessment places fragmentation ahead of budget constraints and organizational resistance, which reflects what data teams encounter in production: the problem isn't collecting records, it's making them comparable. The assessment of PropTech platform consolidation provides useful context for why this issue has become an infrastructure concern.
A broad feed is only useful when the platform exposes the mechanics behind each field. At minimum, the data layer should preserve:
- Source provenance: Record the originating platform, endpoint, extraction method, and source identifier.
- Refresh timestamps: Distinguish the time a record was observed from the time the source says it was updated.
- Field-level confidence: Mark whether a value was directly observed, inferred, transformed, or missing.
- Change history: Keep prior values so analysts can separate a genuine price change from a correction.
- Normalization rules: Document how currencies, units, statuses, property types, and dates were mapped.
The idea of operational intelligence for enterprise leaders becomes relevant here. Operational intelligence only earns trust when users can trace an alert back to the underlying events and transformations, rather than accepting a polished output as an unexplained truth.
Practical rule: A metric without provenance is a presentation feature, not a dependable analytical input.
A real estate analytics platform that works in production is therefore a normalization layer with a user interface, not merely a user interface with several connectors. Engineers need stable identifiers and repeatable transformations. Investment teams need comparable observations and visible uncertainty. If either group can't audit how a number was produced, the platform may create false precision at scale.
Core Architecture and Historical Data Foundations
A dependable architecture separates collection, interpretation, storage, and delivery. Scraping scripts often combine all four in one job, which makes failures difficult to isolate. A source changes its markup, the parser returns empty values, and the resulting dashboard treats missing data as zero. A unified API layer can reduce that coupling by presenting a consistent contract while handling source-specific extraction and retries behind it.
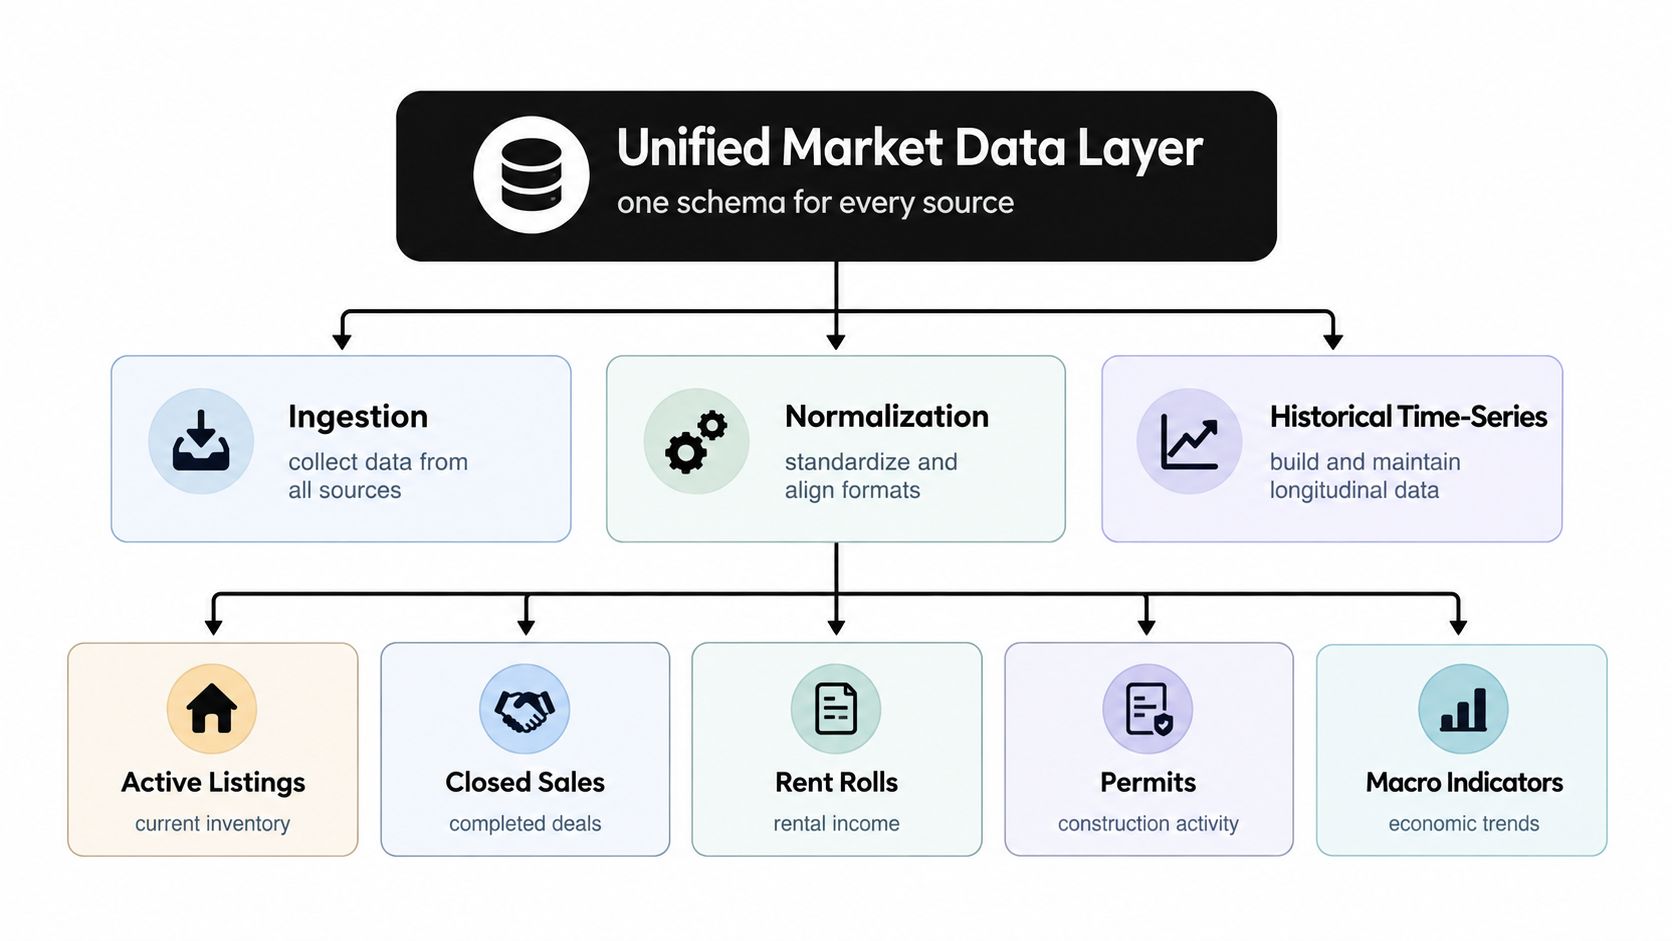
The layers that matter
Ingestion should handle source authentication, request scheduling, pagination, response validation, and failure isolation. A provider that retries immediately can worsen an overloaded source. Intelligent retries with exponential backoff are safer because they give transient failures time to clear without sending a burst of duplicate requests.
Normalization turns source-specific fields into a canonical schema. Teams use it to decide whether a property's displayed price is a nightly rate, monthly rent, asking price, or transaction value. The normalized record should retain the raw value and the transformation metadata, rather than replacing the source value with an opaque calculated field.
Historical time-series storage preserves observations as they change. A current listing endpoint is useful for search, but it can't explain whether a price is normal for the market, whether inventory is seasonal, or whether a sudden shift began after a policy event. Realtor.com's residential data library aggregates MLS-listed homes from hundreds of sources and provides monthly historical series for active listings, listing prices, price per square foot, days on market, and inventory measures. Its published history extends back to July 2016, giving roughly a decade of comparable U.S. observations by 2026. Realtor.com's historical residential data also defines active listings as properties available during a specified month, excluding pending listings when a pending status is available.
That definition matters. If an analyst combines pending and active properties, the system can mistake visible supply for available supply. A time-series model then learns from a contaminated baseline.
DIY scraping versus a unified API
DIY scraping offers control and can be appropriate for a narrow internal experiment. It becomes fragile when a team must monitor many sources, support multiple geographies, handle schema changes, and meet application-level availability expectations. The engineering cost isn't limited to extraction. It includes parser maintenance, duplicate detection, replayable jobs, observability, legal review, and incident response.
A developer-first API changes the operating model. Applications can request normalized records through REST or GraphQL, while the data provider manages source-specific collection. For historical valuation workflows, teams can also connect a dedicated endpoint such as Zestimate history and home values to a broader property data layer. The important design choice is to keep current observations and historical observations queryable through compatible identifiers, so a dashboard doesn't join today's property to the wrong historical entity.
Cross-Market Normalization and Trust Frameworks
Cross-market analysis fails when teams treat normalization as a formatting task. It isn't. Normalization changes the meaning of a record, so every transformation needs a rule, an owner, and a way to reverse the decision back to the source.
A practical audit starts with the property identity and moves outward to status, units, money, dates, and confidence.
Start with identity and status
Create a canonical property ID. Combine stable source identifiers with address components, coordinates, building attributes, and other available signals. Don't rely on the displayed address alone. Formatting differences, translated street names, and unit conventions can make one property look like several.
Deduplicate before aggregation. Use deterministic matches where identifiers are reliable, then apply cautious similarity matching to addresses and coordinates. Store the match decision and its confidence. A false merge can be worse than a duplicate because it contaminates the property's history.
Map local statuses to a controlled vocabulary. Preserve the raw status, then map it to a normalized state such as active, pending, sold, withdrawn, or unavailable. The mapping must be country-aware. “Pending” can indicate a contract stage in one market and a different operational state in another.
Align reporting periods. Store the source timestamp, normalized UTC timestamp, local market date, and reporting period. A daily feed crossing time zones can otherwise place an event in the wrong business day.
The visual checklist below captures the same principle: every normalized value should remain traceable to the raw record.
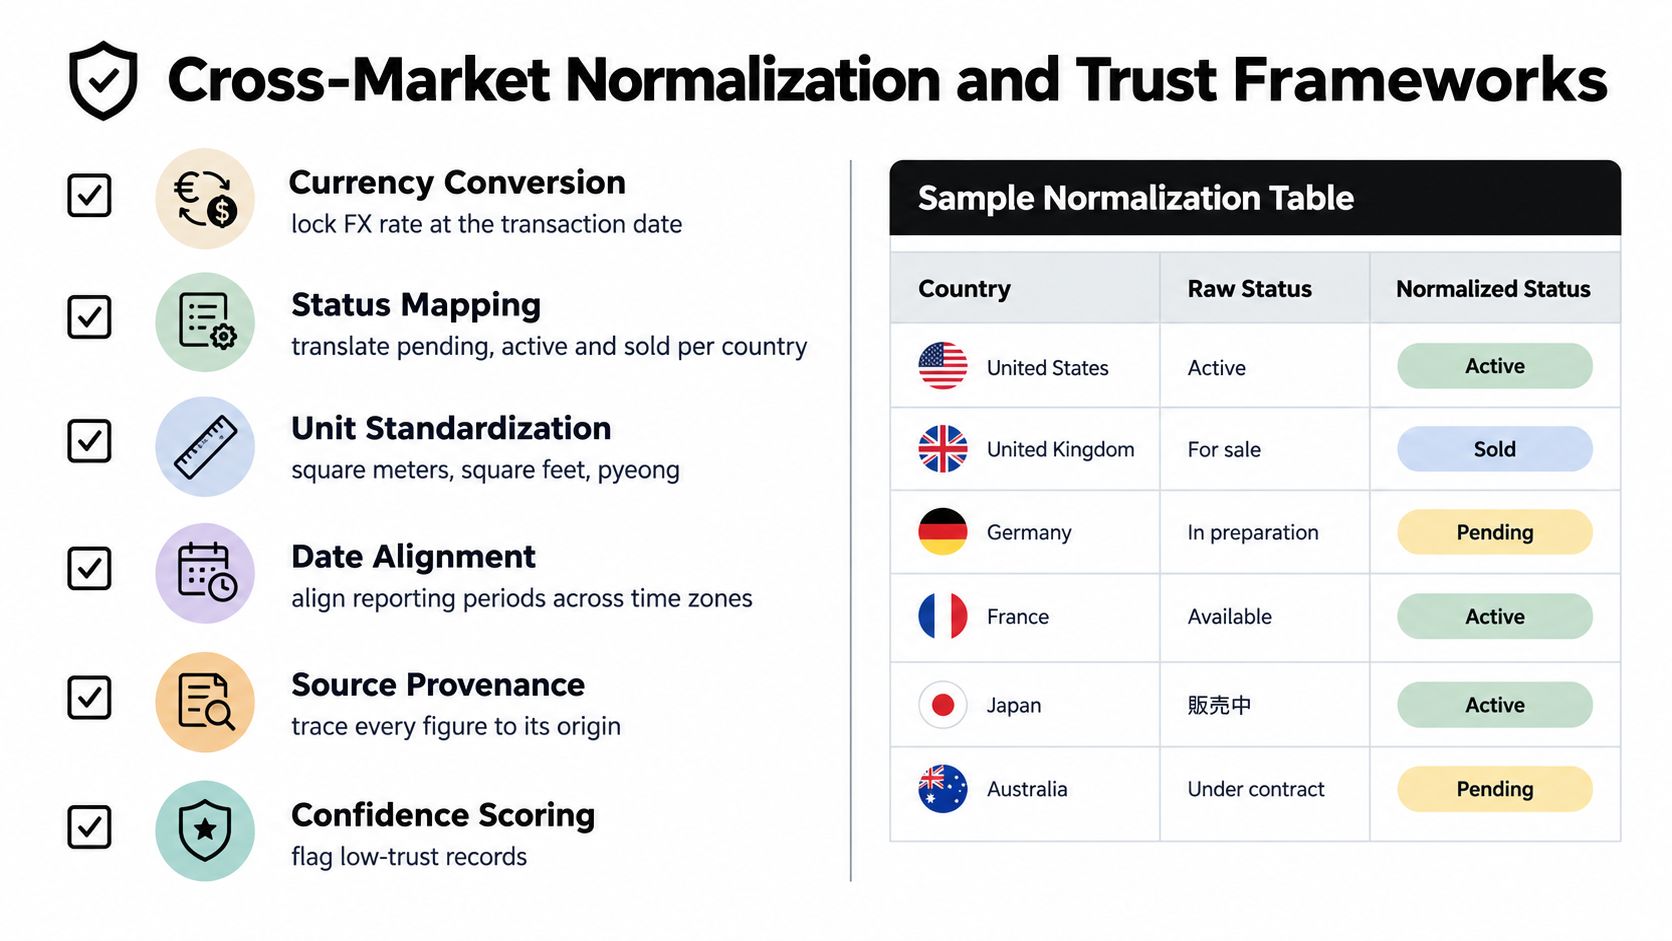
Normalize money, units, and freshness
Currency conversion needs a declared policy. For transaction analysis, lock the exchange rate to the transaction date. For a live dashboard, use a clearly identified observation-time rate and retain the original currency. Never overwrite the raw amount, because analysts may later need to rebuild a result using a different economic assumption.
Unit conversion deserves the same care. Store the original area unit and the canonical unit, whether the source uses square meters, square feet, pyeong, or another local convention. A conversion error can distort price-per-area metrics while leaving the headline price apparently reasonable.
Freshness should be treated as a service-level objective, not a vague promise. Define acceptable age by dataset and use case. A search application may need rapid listing updates, while a historical market series can tolerate a different cadence. Emit stale-record flags, missingness reports, and source-level lag metrics so downstream consumers can exclude or qualify old observations.
Teams working on broader data architecture can use Kagool's perspective on unified data platforms as a useful reference point, but the implementation still needs property-specific controls. A general warehouse won't automatically solve local status semantics or listing identity.
Trust is not a score added at the end. It's the result of preserving every decision made along the pipeline.
Engineering Evaluation Checklist for Data Providers
A provider should be evaluated like an infrastructure dependency, not like a collection of screenshots. The first test is operational: can the service deliver consistent responses when traffic rises, sources slow down, and your application retries a request? The second is analytical: can your team explain how a returned field was sourced and transformed?
Latency matters, but a low average response time doesn't compensate for unpredictable failures. Look for documented timeout behavior, idempotent requests, structured errors, exponential backoff guidance, and monitoring hooks. Global edge delivery can reduce distance-related delay, while autoscaling helps absorb changing demand. Those capabilities should be tested against your own request patterns rather than accepted from a product page.
Rate limits also need careful interpretation. A provider that advertises no rate limits may still apply fair-use controls, source-specific constraints, or concurrency protections. Ask how those controls are communicated, whether responses include retry guidance, and whether usage can be observed before an application reaches a failure threshold.
Platform Evaluation Matrix
| Evaluation Criteria | Production Requirement | Why It Matters |
|---|---|---|
| Response performance | Consistent low-latency behavior with documented timeout handling | Slow or unpredictable calls can block search, alerts, and batch jobs |
| Retry behavior | Intelligent retries with exponential backoff and clear error classes | Prevents transient source failures from becoming pipeline outages |
| Delivery footprint | Global edge delivery and capacity that scales with demand | Reduces regional latency and protects high-traffic applications |
| Usage controls | Transparent limits, concurrency guidance, and observable consumption | Helps engineers plan capacity instead of discovering restrictions in production |
| Data provenance | Source identifiers, timestamps, raw values, and transformation details | Lets analysts audit metrics and investigate disputed results |
| Compliance posture | Clear sourcing policies for publicly available information and privacy controls | Reduces legal and operational uncertainty during procurement |
| Commercial model | Transparent pay-as-you-go pricing, clear overages, and credits that don't expire | Makes prototyping and seasonal workloads easier to budget |
| SDK and API surface | Stable REST or GraphQL contracts with practical examples | Shortens integration time and reduces custom connector maintenance |
| Observability | Health signals, request logs, freshness indicators, and incident communication | Gives teams enough context to diagnose failures quickly |
What to test before procurement
Run the same query across different geographies and property types. Compare field completeness, status mapping, duplicate behavior, and response shape. Then simulate a source timeout, a malformed record, a repeated request, and a batch workload. A provider should explain what your application receives in each case.
Compliance review should include the origin of public data, retention rules, permitted uses, and handling of personal information. “Publicly available” doesn't remove the need for responsible processing. A serious vendor should make its sourcing and privacy position understandable to engineering, legal, and security teams.
Integration Workflows for PropTech and Investment Teams
The best integration pattern depends on the decision the application needs to support. A short-term rental operator cares about availability changes. A marketplace needs fast property retrieval and stable place identifiers. An investment analyst needs repeatable historical pulls and assumptions that survive review.
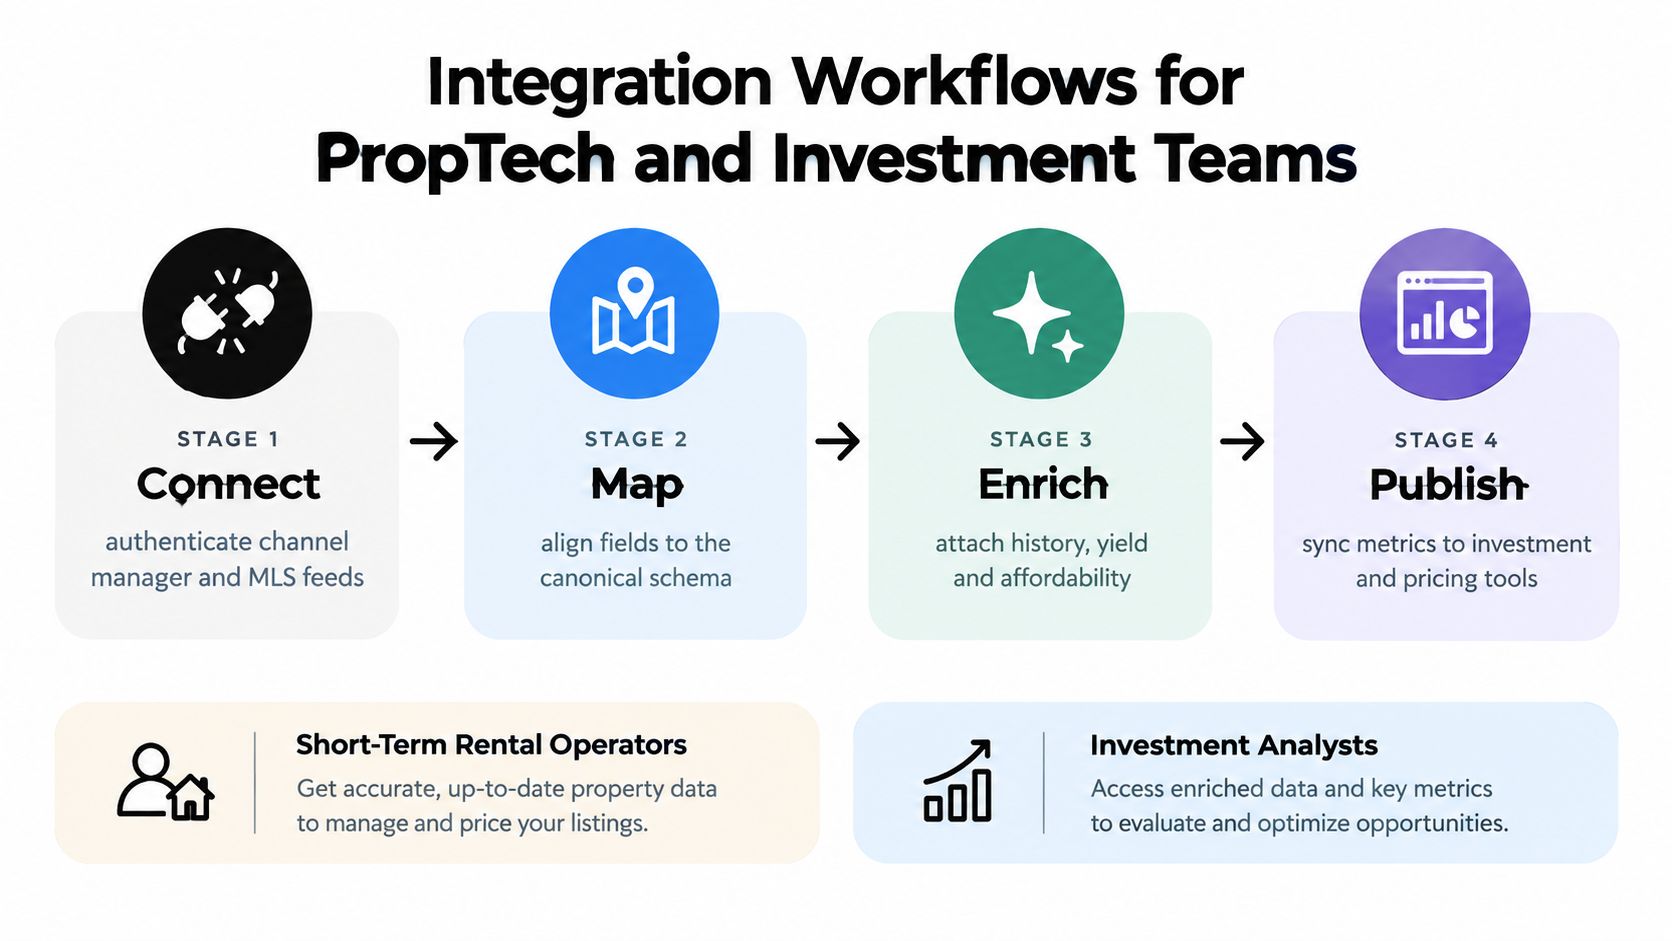
Short-term rental operations
A channel manager can subscribe to listing or availability events through webhooks, validate the event signature, and place the payload on a queue. The consumer should be idempotent, because delivery systems can retry an event. It then resolves the canonical property ID, compares the new availability window with the previous state, and updates downstream calendars only when the state has changed.
That workflow is safer than polling every property on a fixed schedule. Polling can waste requests when nothing changes and still miss a short-lived update between intervals. Webhooks are not a substitute for reconciliation, though. A scheduled backfill should periodically compare the local state with the source state and repair missed events.
Marketplaces and search products
A marketplace typically begins with destination, coordinates, place ID, or URL search. The API response should provide a stable identifier that the application stores separately from the display title and address. Rich details, amenities, reviews, host attributes, and accessibility fields can then be loaded on demand instead of inflating every search response.
The production pattern is straightforward:
- Search lightly: Return the fields needed to render result cards.
- Resolve details selectively: Fetch full property information after a user opens a result.
- Cache with care: Cache stable attributes separately from prices and availability.
- Track provenance: Show or store the retrieval timestamp for material market fields.
- Handle absence explicitly: Treat missing amenities or reviews as unknown, not as negative values.
A unified API with REST, GraphQL, and webhooks can support these different request shapes without forcing every product team to maintain separate scrapers. The integration documentation is the right place to verify authentication, event handling, and endpoint behavior before designing the application contract.
Investment data pipelines
An investment fund usually benefits from bulk extraction rather than interactive calls. A Python worker can request pricing trends by market, validate the schema, write raw responses to immutable storage, and publish normalized records to an analytical warehouse. Analysts can then run models against a reproducible snapshot instead of a constantly changing live response.
GraphQL is useful when the model needs a controlled selection of fields across related entities. REST can be simpler for scheduled extraction and operational services. Neither is automatically better. Choose the interface that makes query shape, pagination, error handling, and schema versioning easiest to observe.
A reliable integration separates source retrieval from investment logic. If a pricing model is embedded inside the ingestion job, a source correction can become a model change without anyone noticing.
Modeling Affordability and Structural Regime Changes
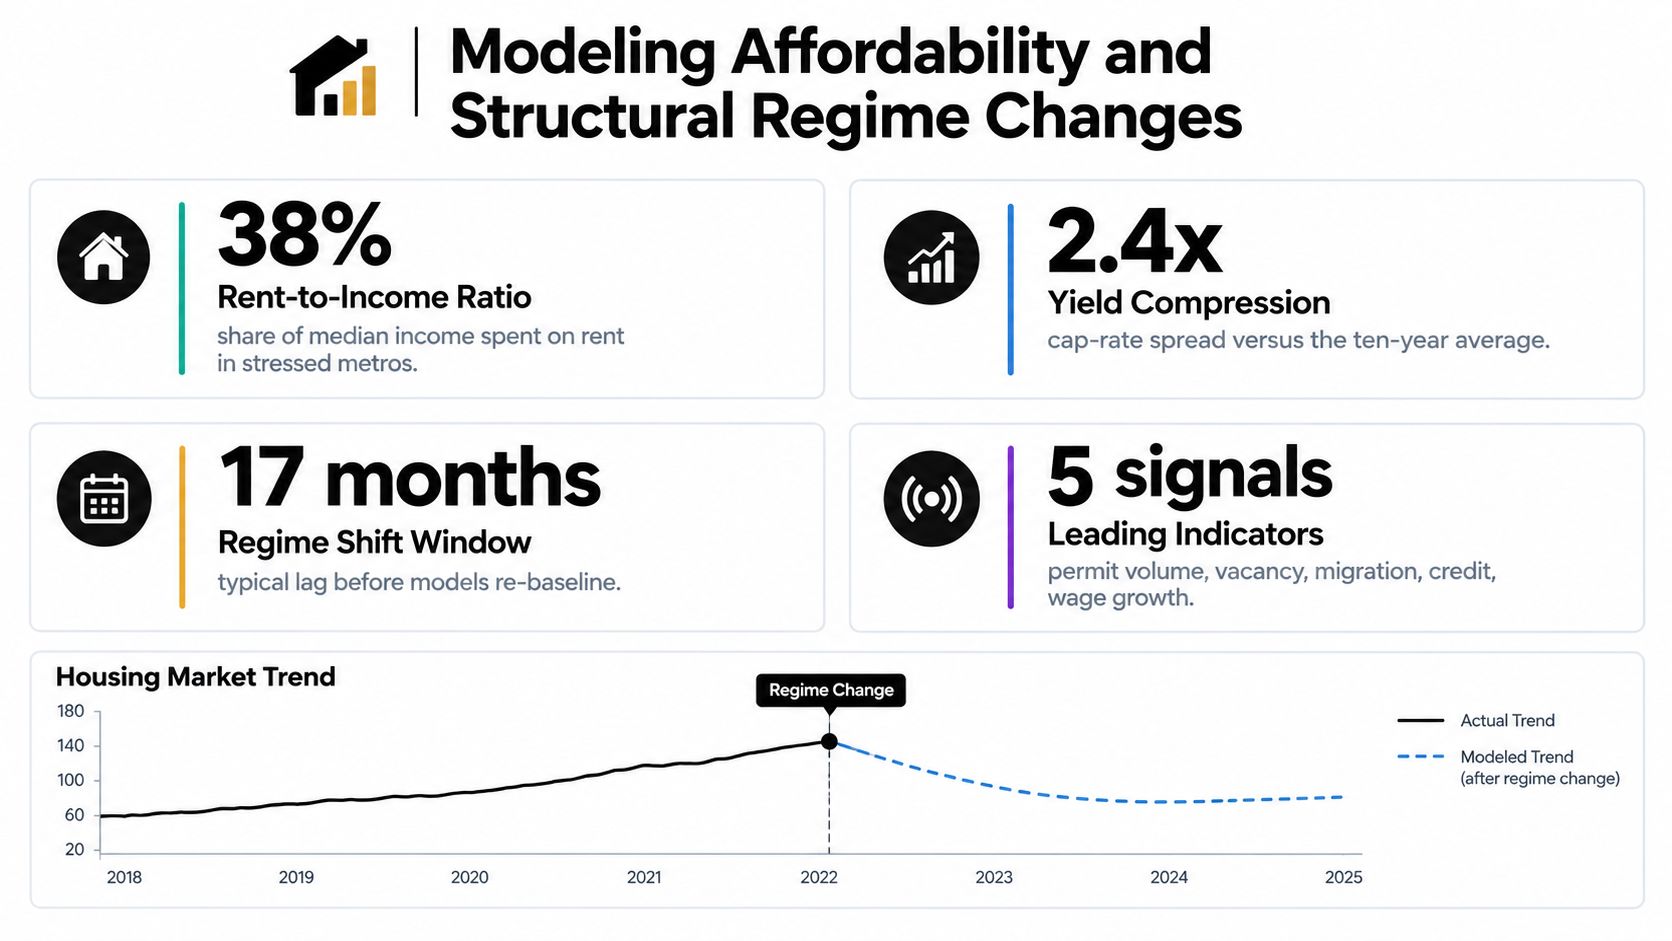
Historical models often fail for a simple reason: the market changes before the dashboard does. New infrastructure, energy constraints, migration, regulation, or financing conditions can shift demand and supply faster than a fixed trend can adapt. A production analytics platform should therefore separate observed facts, assumptions, and inferred forecasts, with each field traceable to its source and observation date.
Affordability provides a practical test case because a nominal price says little about who can access a market. A widely used rule treats housing as affordable when a household spends no more than 30% of monthly income on housing costs, as described by HUD's affordability analysis. Implement that threshold as a transparent classification, not as an unexplained proprietary score. A tool such as the affordability calculator shows how the inputs combine in practice.
Preserve the assumptions behind affordability
An affordability feature should retain:
- Household income and income segment.
- Home price or rent, with the source type clearly labeled.
- Mortgage rate, term, and down-payment assumption.
- Property taxes, insurance, mortgage insurance, and other recurring costs.
- Currency, geography, observation date, and household composition where available.
Those fields determine whether a result can be reproduced. The NAHB 2025 affordability analysis found that 74.9% of U.S. households, about 100.6 million of 141.1 million households, could not afford a median-priced new home under its stated assumptions. The analysis used a $459,826 median new-home price, a 6.5% 30-year mortgage rate, and a $141,366 minimum qualifying income. The result is useful because the inputs remain visible, not because the percentage can be reused without context.
Methodology also determines whether markets can be compared. The NAHB/Wells Fargo Cost of Housing Index assumes a 10% down payment and includes property taxes, homeowners insurance, and private mortgage insurance. In the first quarter of 2025, a family earning the national median income of $104,200 needed 36% of income for the mortgage payment on a median-priced new home, while a low-income family earning 50% of median income needed 72%. The index also reported a $416,900 median new-home price, which is why new-home and existing-home inputs should remain separate fields.
Detect a regime shift
Structural-change models need event timestamps on scenario inputs. Compare a baseline forecast with alternatives for financing, regulation, infrastructure, supply withdrawals, migration, and short-term rental restrictions. Trigger alerts when observed values leave expected ranges, then identify the assumption that failed. An alert should support investigation, not label a forecast merely correct or incorrect.
The 2025 Emerging Trends outlook from PwC and the Urban Land Institute identifies data centres as the leading opportunity named by industry leaders across the United States, Europe, and Asia Pacific, alongside attention to energy infrastructure and data sovereignty. The global outlook shows why a historical trend can miss a new demand driver.
Segment listing affordability by household income and measure it as a share of available inventory. NAR reported that in March 2025, 21.2% of listings were affordable to households earning $75,000, compared with 8.7% for households earning $50,000 and 37.1% for households earning $100,000. NAR's affordability and supply data demonstrates why one median price can conceal very different access conditions.
Shipping Your First Analytics Feature
Start with one decision, not a collection of endpoints. A useful first feature might be market monitoring, global property search, affordability classification, or a price-history view. Define the input, output, freshness requirement, and failure behavior before writing the integration.
A practical deployment sequence
Create the API key and isolate credentials. Keep secrets outside application code, use separate environments, and log request metadata without exposing sensitive values.
Run test queries across different markets. Check how the response handles currencies, units, missing fields, property types, and local statuses. Save representative fixtures so schema changes can be tested before deployment.
Build a raw-to-normalized path. Store the original response, map it to your canonical schema, and record the transformation version. Don't make the dashboard the only place where data exists.
Add freshness and endpoint monitoring. Track response errors, latency, empty results, stale records, and unexpected schema changes. Alert on symptoms that affect decisions, not only on infrastructure failures.
Release with a narrow audience. Let one internal team or one product workflow use the feature first. Review mismatches manually, refine mappings, and document exceptions before expanding coverage.
Teams that want to validate product demand before building a full engineering stack can use a low-code approach to create a real estate MVP. For hands-on query testing, the API Playground helps engineers inspect responses and shape an initial contract before wiring production services.
The first release doesn't need every market or metric. It needs a traceable data path, clear assumptions, observable failures, and an output that helps a specific user make a better decision.
RealtyAPI.io provides a unified API for live property listings, pricing trends, rental data, and market signals, with REST, GraphQL, and webhooks for search, monitoring, and analytical workflows. Visit RealtyAPI.io to test a developer-first data layer and start building a real estate analytics feature without taking on every source-specific pipeline yourself.