Pricing Trend Analysis: A Practical Guide for Real Estate

A lot of teams hit the same wall. Listings keep inching up, rent asks look firmer on the surface, and the dashboard still says the market is “stable.” Then operators look at bookings, accepted offers, or time on market and realize the pressure has shifted long before the headline metric admitted it.
That gap is where pricing trend analysis earns its keep. In real estate, you rarely have the luxury of one clean market price. You have list prices, closed prices, stale listings, partial property attributes, regional mix changes, and a moving target on seasonality. If you don't structure that mess properly, you end up measuring composition, not trend.
Why Pricing Trend Analysis Matters in Real Estate
A marketplace operator can watch asking rents rise on active inventory while realized revenue stalls. A brokerage can see median sale prices hold steady while sellers cut pricing to get showings. An investment team can underwrite a buy box using last quarter's comps and miss that the softening started in one property segment first.
That isn't a data access problem. It's a signal extraction problem.
Where teams get misled
Most real estate teams start with whatever is easiest to pull. Median list price by week. Average sold price by ZIP. Maybe a month-over-month chart with a line going up and to the right. Those are useful first reads, but they break fast when the mix of homes changes.
A market can look stronger than it is because smaller homes enter inventory. It can look weaker than it is because luxury listings suddenly dominate the sample. National summaries make this worse because local stress gets averaged away.
Global inflation data is a reminder that broad price movement and local price movement are never the same thing. The IMF reported annual global inflation at 3.6% in September 2025, unchanged from August and July, while regional dispersion remained wide, including 10.0% in Africa in June 2026, 4.8% in the Americas in June 2026, and 3.4% in Europe in June 2026 according to the IMF inflation data brief. In property analytics, the same principle applies. You need the broad backdrop, but you also need the regional split.
Practical rule: If your trend view can't tell you whether the move is broad-based or concentrated in a few submarkets, it isn't decision-grade yet.
What it changes operationally
Good pricing trend analysis improves four things quickly:
- Underwriting discipline: Teams stop treating one recent comp set as a timeless truth.
- Dynamic pricing logic: Rental and STR operators can adjust against real demand pressure, not just visible asks.
- Competitive benchmarking: Portals and brokerages can compare neighborhoods on a like-for-like basis.
- Investor communication: You can explain not just where pricing is, but why confidence in that signal is high or low.
For teams building product, that often starts with a baseline trend source such as the Zillow housing market ZHVI endpoint, then layering more sensitive indicators on top. The point isn't to worship one index. It's to stop reacting to lagging summaries after the market has already moved.
What Pricing Trend Analysis Means
A familiar reporting problem shows up fast in live market feeds. Median list price holds steady for six weeks, stakeholders assume the market is flat, and then price cuts climb, larger homes drop out of the sample, and pending volume weakens. The visible price line barely moves, but market pressure does.
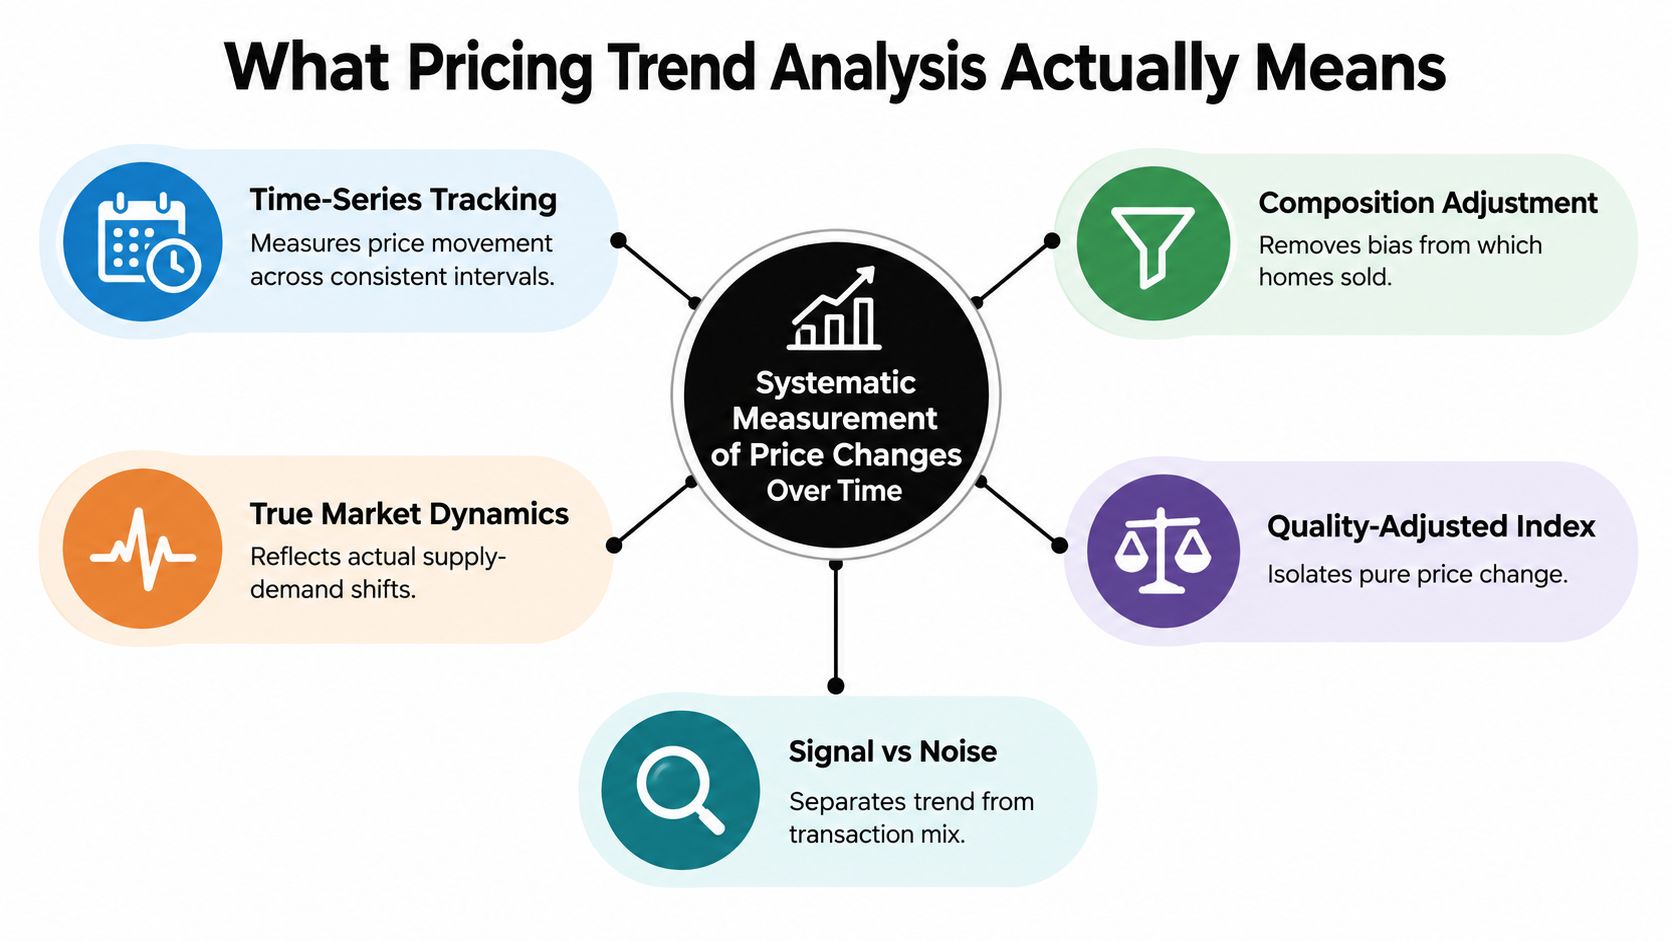
Pricing trend analysis measures price movement over time after adjusting for changes in the mix of properties in each period. That adjustment is the difference between a useful trend and a noisy summary.
If ten condos sold last month and ten detached homes sold this month, the median may rise even if underlying market pricing did not. The reverse happens too. Raw medians are still worth tracking, but they are mix-sensitive, so they should not carry the full interpretation load.
From observed prices to a usable index
The mechanics are simple in principle. Pick a base period, express later prices relative to it, and adjust for the mix of properties in each period so the series tracks price movement rather than sample turnover.
That can be done with repeat-sales pairs, hedonic controls, or a simpler stratified approach if coverage is thin. Each choice changes what the series is good at. In rental dashboards, I usually trust quality-adjusted asking-rent trends only when attribute coverage is stable enough to support them. In for-sale markets, repeat-sales series are cleaner on pure price change, but they thin out quickly outside high-turnover areas.
The Zoopla price history endpoint helps because it gives property-level sequence data instead of a single market snapshot. That makes it easier to separate genuine repricing from sample churn, and to compare list history against later cuts or relists in the same record. For index design, the methodological baseline is closer to the construction principles described by Eurostat's HICP methodology.
Why two analysts can disagree and still be using defensible methods
Many pricing disputes are measurement disputes.
One analyst is looking at nominal asking prices. Another is looking at closed-sale prices with a three-month lag. One is using medians. Another is using a quality-adjusted index. One is reading metro-level stability. Another is looking at one submarket where concessions and cuts are rising.
That is why list-price stability should never be read alone. In production dashboards, I put it beside price-cut incidence, median dollars per square foot, and regional splits. If the headline price is flat while cut rates rise and $/sqft softens in the same cohort, the market is usually weaker than the top-line series suggests.
Historical depth helps too, but only if the series is normalized consistently. A long history of inconsistent medians is less useful than a shorter series built on a stable method.
Statistical Methods That Power Pricing Trends
A pricing series can look stable while the market underneath it is shifting. The method decides whether you are measuring appreciation, seller intent, or pressure building inside the listing funnel.
That is why there is no single "best" model in production. There are several method families, and each fails in a specific, repeatable way.
The five methods that show up in real production work
Teams building investor dashboards need something different from teams feeding AVMs, brokerage analytics, or rental pricing tools. Match the method to the operating question.
| Method | Best Use Case | Key Limitation |
|---|---|---|
| Time-series decomposition | Separating long trend from recurring seasonality in market-level series | Short windows can push seasonal noise into the trend component |
| Seasonal adjustment | Making month-over-month comparisons more usable | Breaks down when calendar effects shift or inventory regimes change |
| Hedonic regression | Estimating quality-adjusted price movement across active listings or sales | Missing, stale, or inconsistently coded attributes create coefficient drift |
| Repeat-sales | Tracking price change for the same property over time | Thin resale pair counts reduce coverage and can skew toward older housing stock |
| Cohort analysis | Following listing vintages, segments, or contract cohorts | Strong for pressure and conversion analysis, weaker as a market-wide valuation index |
Hedonic versus repeat-sales
This is the choice that usually matters most.
Repeat-sales compares the same property across two sale dates. The IMF notes that the method only needs price, sales date, and address, which makes it far less demanding than a full hedonic setup when attributes are sparse or unreliable, in its discussion of repeat-sales house price indexes. In recorder-heavy markets with enough turnover, that simplicity is a real advantage. You get a cleaner signal on appreciation because you are not constantly correcting for mix shift across unit size, quality, or neighborhood composition.
The trade-off is coverage. Repeat-sales underrepresents new construction, low-turnover suburbs, and any segment where resales are infrequent. It can also bias the story toward homes that transact more often, which is not always the same thing as the broader market.
Hedonic models estimate price as a function of property characteristics. The OECD describes them as regressions of price on a vector of attributes whose implicit values are not directly observed, in its work on hedonic price indexes for housing. In practice, hedonic models are what I use when the business needs attribution instead of just a directional index. Size, bedrooms, lot, property type, micro-location, renovation proxies, and amenity flags can all explain why one segment is moving differently from another.
They are also easier to misuse. If square footage is missing for a meaningful share of listings, or if condition fields are entered inconsistently across MLS feeds, the model can produce precise-looking noise.
A related production choice is temporal aggregation. Some house price index methods use rolling or multi-month groupings to stabilize estimates when monthly samples are thin. The FHFA house price index methodology material is useful here because it shows how index builders handle smoothing and interval design to reduce volatility from sparse observations. That matters a lot once you cut the market into ZIPs, bedroom bands, or property types.
A usable selection rule
A quick rule set works better than abstract theory when a dashboard has to ship.
- Choose hedonic when attribute coverage is good and users will ask why one segment moved differently from another.
- Choose repeat-sales when sale history is deep enough to form reliable pairs and the goal is a cleaner appreciation signal.
- Use decomposition when the series is dominated by seasonality, which is common in rentals and highly cyclical local markets.
- Use cohorts when you need to separate list-price stability from real market pressure by tracking cuts, relists, days on market, or conversion by listing vintage.
In practice, I rarely trust one method alone. I want the index, the mix-adjusted $/sqft view, the price-cut trend, and a regional split on the same screen. If those disagree, that is usually the useful part of the analysis.
For a fast cross-check, I also compare formal trend models against recent estimate movement from the Zestimate percent change endpoint. It does not settle valuation. It helps flag where your primary method may be overstating stability because of sample churn, lagged closings, or weak feature coverage.
The Hidden Gap Between Headline Prices and Market Pressure
Many dashboards fail. They treat median price as the market. It isn't.
In U.S. housing, national median list prices were nearly flat in mid-2025, yet price cuts reached 19.1% of listings in May and 20.7% in June, the highest June level since at least 2016, while price per square foot still rose 0.6% to 0.7% year over year in the Realtor.com June 2025 market data. That's a classic example of a market that looks steady in one lens and softer in another.
Three lenses that should never be collapsed into one
| Metric | What It Measures | Direction of Softening | Lead vs. Median Sale Price |
|---|---|---|---|
| Median list price | Seller intent and current ask positioning | Flattens late when sellers resist repricing | Usually slower |
| Median sale price | What actually clears in closed transactions | Confirms softening after contracts reset | Usually lagging |
| Price per square foot | Mix-adjusted intensity of pricing across unit size | Can stay firm even while bargaining power weakens | Often more sensitive than median |
A stable median list price can coexist with weaker seller negotiating power. That's common when sellers anchor to prior comps, while buyers push concessions through cuts, longer marketing time, or smaller accepted bids.
What actually signals pressure
I trust price-cut incidence more than headline median when I want an early read on stress. It tells you how many sellers had to abandon the first ask. Pair that with price per square foot and days on market, and you get a much sharper sense of who still has an advantage.
If cuts are rising while price per square foot is still up, the market isn't uniformly strong. It's usually repricing unevenly.
Regional divergence matters too. FHFA reported U.S. house prices up 2.9% year over year in Q2 2025 and 1.8% in Q4 2025, while HUD noted annual house price growth slowed to 2.8% in May 2025. The same summary noted widening regional splits, and NAR reported the Northeast up 5.5% in Q4 2025 while the West posted a slight decline, according to the FHFA house price index release. That is exactly why “up or down” is the wrong question. The better one is, “Where is pricing diverging, and which segment is carrying the weakness?”
That framing also helps agents and marketplace operators win more listings with data, because sellers respond better to evidence about local pressure than to recycled national headlines.
Data Sources, Quality Checks, and an API Workflow
A reliable trend stack usually starts with two uncomfortable truths. First, no single source is complete. Second, most errors happen before modeling.
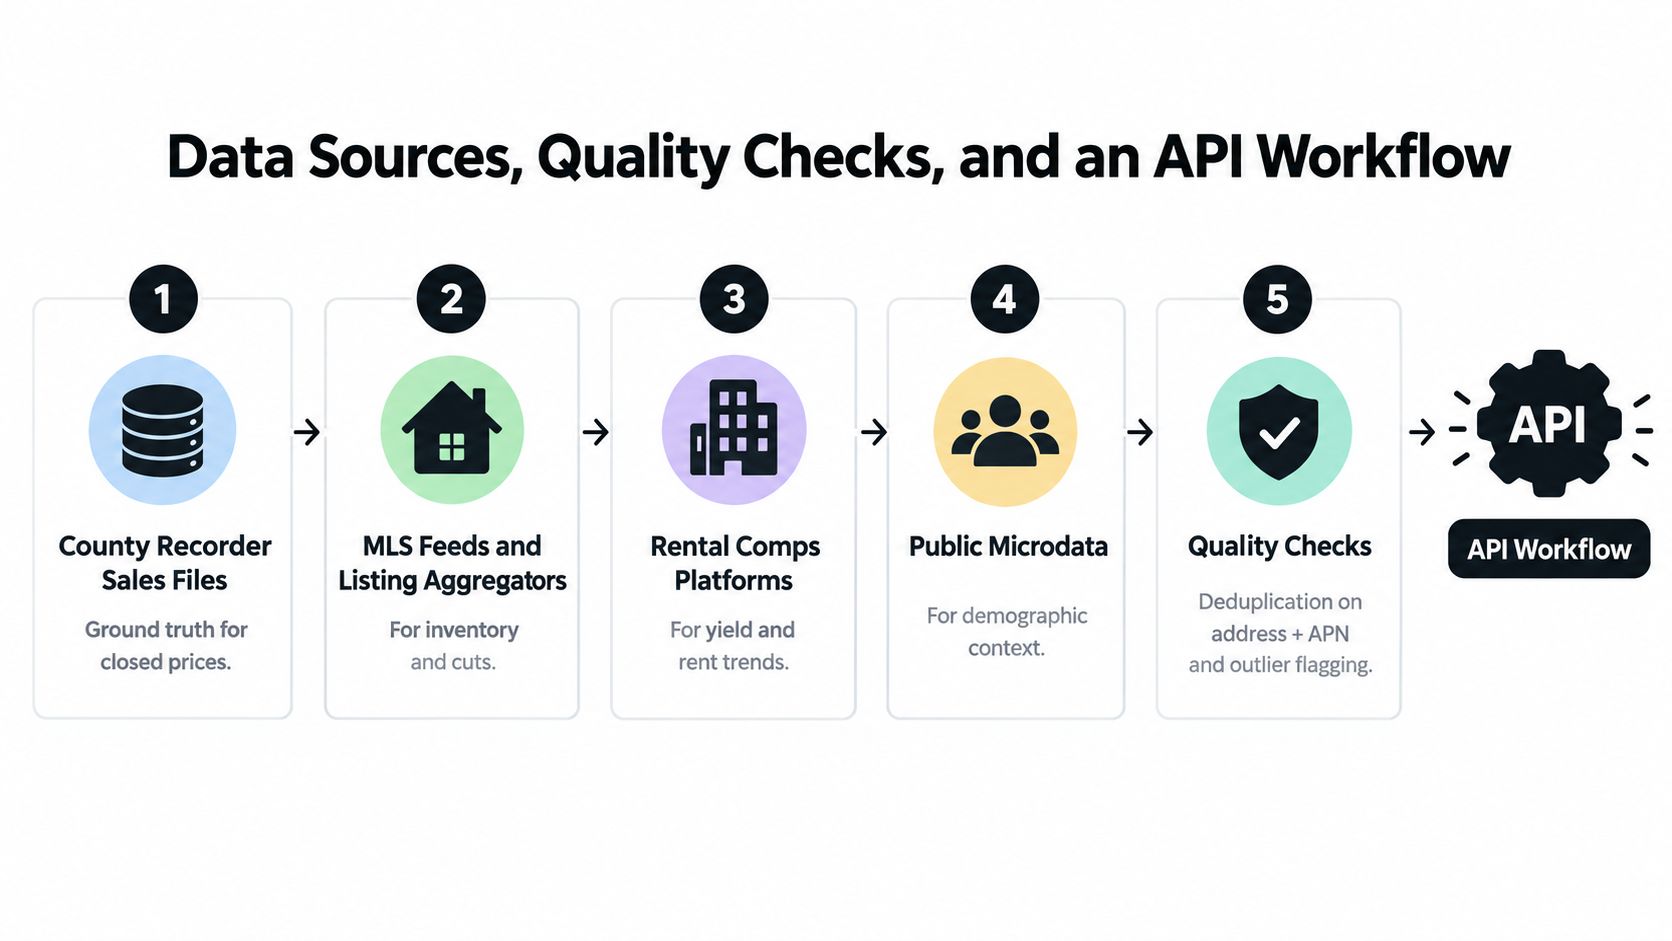
County recorder files give you closed-sale ground truth. MLS feeds and listing aggregators capture active inventory, relists, and price changes. Rental comps feeds tell you what operators are asking and how availability is shifting. Public microdata adds neighborhood context, but it usually isn't precise enough to stand in for transactional pricing.
The quality checks that matter most
If you skip these, your trend line will lie to you.
- Deduplicate aggressively: Match on normalized address plus APN where available. Relists and feed merges create fake inventory churn.
- Flag outliers on price per square foot: IQR-style trimming is usually safer than hard caps because neighborhoods have different price distributions.
- Track mix-adjustment state: Every chart should make clear whether it's raw median, constrained cohort, repeat-sales, or hedonic-adjusted.
- Handle delist survivorship: Off-market removals can make supply look tighter than it is if you only count what remains visible.
- Separate listing and transaction clocks: A list-price move today and a closed sale next month don't belong in the same timing bucket.
The historical pricing analysis workflow used in ecommerce is surprisingly relevant here. Lengow's overview argues that teams need own price history, units, revenue, fees, returns, margin, and matched competitor pricing across channels such as Amazon, Zalando, Cdiscount, OTTO, eBay, Bol, Allegro, and Google Shopping in its piece on historical pricing trends and analysis. Real estate isn't retail, but the operational lesson carries over: trend work improves when you preserve event history, not just the latest state.
A working pipeline
I prefer a simple pipeline that teams can rerun without heroics:
- Ingest raw recorder, listing, and rental data.
- Normalize addresses, timestamps, currencies, unit measures, and listing states.
- Geo-attach parcels, census geographies, school zones, and neighborhood IDs.
- Index with the method that matches your data quality.
- Visualize both the headline trend and the pressure diagnostics beside it.
This is also where a unified API layer helps. One option is to use RealtyAPI integrations documentation to wire listing feeds and market signals into a repeatable workflow without building custom connectors for every source.
For analysts building product features, the API workflow usually looks like this:
- Pull active listings with price history to compute price-cut incidence.
- Fetch property records to assemble repeat-sales pairs when the same parcel transacts again.
- Request market analytics endpoints for regional medians and price-per-square-foot trends.
- Store everything in long-form event tables so you can rebuild historical states, not just current views.
Here's a practical content rule I use in dashboards: every headline chart gets a companion validation chart. If the median list price says “stable,” I want cuts, inventory age, and price per square foot sitting next to it before anyone presents that trend to leadership.
A short walkthrough helps when you're setting this up in a product team:
Common Interpretation Mistakes and How to Avoid Them
Bad pricing reads usually come from a handful of repeat mistakes. They aren't exotic. They're ordinary shortcuts that survive because the chart still looks polished.
The mistakes I see most often
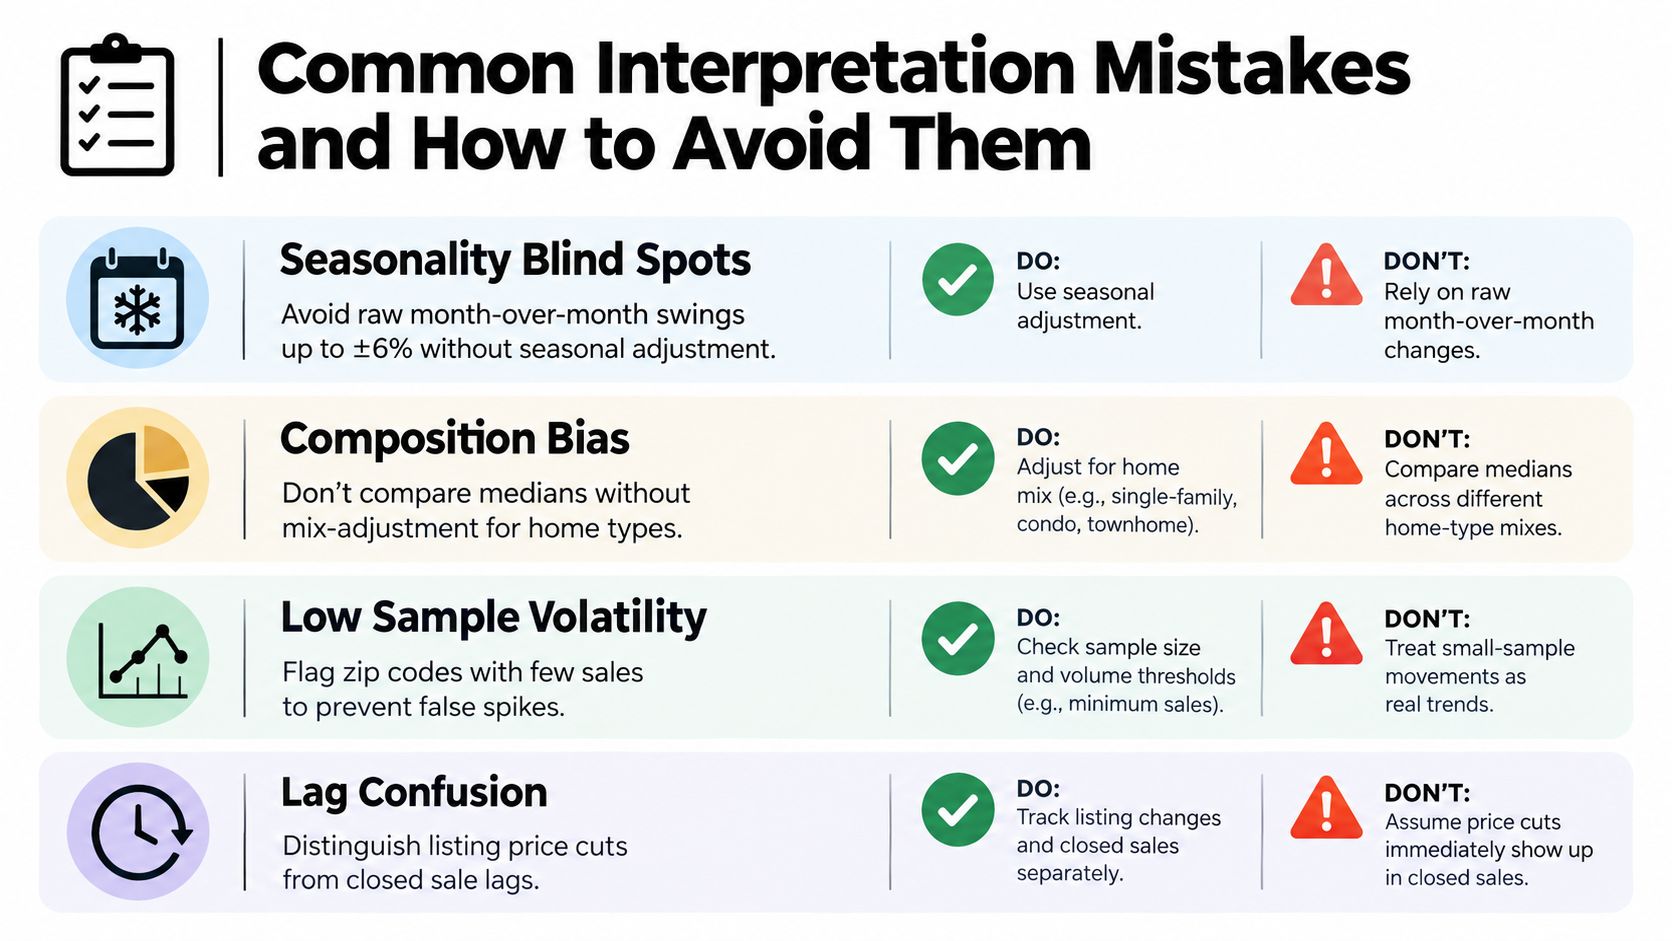
- Seasonality blindness: Teams compare raw month-over-month moves in rentals, leases, or listings and mistake normal calendar effects for trend.
- Mix shift confusion: Luxury share rises, entry-level demand softens, and the median still prints stronger than the lived market.
- Survivorship bias: Only the listings that remain active get counted, while delisted failures disappear from the story.
- List-to-close slippage: Analysts treat list prices as if they were transacted prices, then double-count stale inventory.
- Geographic averaging: One hot pocket and one cooling pocket get blended into a neutral metro headline.
The fixes are straightforward
Use a seasonal adjustment process for any recurring monthly comparison. If the mix is unstable, run a hedonic specification or track a fixed cohort panel. If listing churn is part of the story, preserve delists and status changes as events rather than snapshots.
The easiest dashboard test is this: if a metric improves, ask which homes disappeared, which homes entered, and whether the comparison window is seasonally fair.
Before publishing any market view, I like a short checklist:
- Check sample stability
- Compare at least one raw metric and one adjusted metric
- Review submarket splits before publishing metro-level conclusions
- Put list-price pressure metrics beside any sale-price chart
- Annotate refresh cadence and data lag
That discipline prevents the most common failure in pricing trend analysis. Presenting confidence where the data only supports direction.
PropTech Use Cases and Key Takeaways
The practical value of pricing trend analysis shows up fastest in product decisions.
Where it pays off
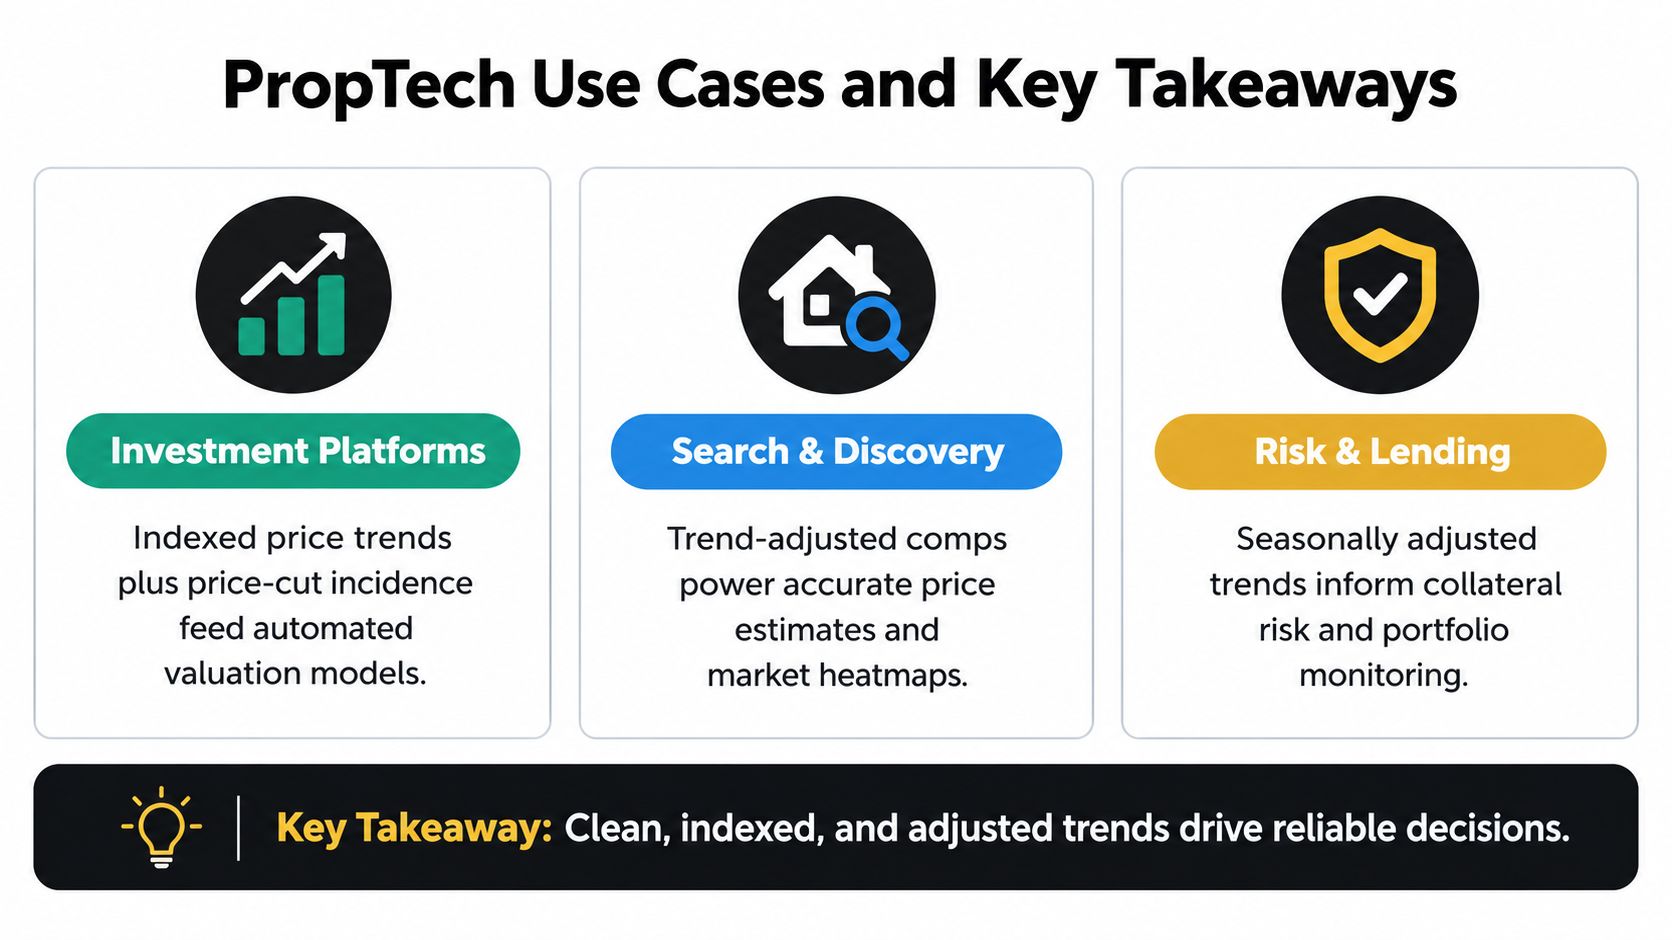
For investment platforms, indexed price movement plus price-cut incidence gives AVMs and buy-box rules a more realistic read on falling or firming demand. A market with stable medians but rising cuts shouldn't trigger the same acquisition logic as a market with broad-based appreciation.
For marketplaces, portals, and broker CRM products, users make better decisions when you show more than one heat signal. Headline medians help with orientation, but price-per-square-foot divergence, inventory age, and regional splits help explain why one neighborhood still attracts offers while another is starting to stall.
For short-term rental operators, seasonality decomposition matters as much as price level. Dynamic pricing works better when ADR and occupancy cohorts are separated from calendar effects instead of being fed in raw.
The checklist that holds up in production
Use this when you're building or revising a pricing dashboard:
- Match the method to the data: Rich attributes favor hedonic models. Deep resale history favors repeat-sales.
- Layer pressure metrics: Don't stop at headline price. Add cuts, inventory aging, and price per square foot.
- Build seasonality into every recurring comparison: Especially for rentals and short-term stays.
- Validate out of sample: A trend model that only fits the past is a reporting artifact, not an operating tool.
- Document refresh cadence: Stakeholders trust numbers more when they know how current they are.
For teams packaging these insights into outreach or acquisition motions, it's also worth studying broader property investment campaign strategies so your pricing intelligence doesn't stay trapped inside analytics and informs go-to-market decisions.
Real estate products need more than headline medians. They need clean listing history, transaction context, and market signals that can be turned into repeatable trend models. RealtyAPI.io gives developers a unified way to pull public real estate data, pricing trends, and live market signals so they can build those workflows into dashboards, valuation tools, and market monitoring products.