Price Per Square Foot: A Clear Guide to Calculating It
Price per square foot is a property's listing price divided by its total square footage, so a home listed for $400,000 with 2,000 square feet costs $200 per square foot. That's the number you see on almost every listing portal, spreadsheet and market ranking you open.
You're probably staring at one right now. Two homes on the same street, two cities in the same dashboard, or a shortlist for an investment, and the cheaper one per square foot looks like the obvious buy. That ranking only holds if both figures count the same space, use the same kind of price and cover the same kind of property. When they don't, the lower figure is often a measurement artifact, not a bargain. The maths takes seconds. Checking the denominator, the sample and the affordability context is where you'll find the answer.
The Price Per Square Foot Formula, Worked Through
Start with the arithmetic, because the arithmetic is the easy part. A home listed at $400,000 with 2,000 square feet gives $400,000 divided by 2,000, which equals $200 per square foot. Each unit of space in that listing costs $200 at the asking price. Two inputs, one division, and the result lands in every comparison table you will ever build.
The calculation works like miles per gallon on a car. Total fuel burned on a trip tells you almost nothing about efficiency, because a bigger vehicle or a longer route uses more fuel by default. Divide fuel by distance and you get a rate that compares a small car against a truck on equal terms. Dividing price by area does the same for homes. A large home will almost always carry a larger total price, and the per-foot figure strips size out of the comparison so you get a unit price you can place beside other listings.
A unit price is all it is, though. $200 per square foot says nothing yet about whether that home is expensive or cheap, because the answer depends on what the denominator counted and what you compare the result against.
Doing the Division Cleanly
Most divisions don't land on a round number. When they don't, round the result to two decimal places so two analysts working from the same listing record the same figure. Rounding isn't cosmetic. It stops tiny presentation differences from reading as real price gaps in a spreadsheet.
The price input is usually visible and unambiguous on a listing. The area input carries more ambiguity: a seller, a portal and a county assessor can each report a different square footage for the same property, and every version produces a different answer from the same price. The formula can't tell you which area is right. It only converts whatever area you feed it.
Practical rule: Never record a price per square foot without recording which area measure produced it. A number without its denominator can't be checked later.
A One Minute Checklist for Any Listing
Run these five steps in order and you can calculate the figure for any listing in under a minute.
- Price: Note the exact listing price and whether it's an asking price or a completed sale price.
- Area: Note the square footage exactly as stated, along with who measured it.
- Divide: Divide price by area using the full figures, not rounded shortcuts.
- Round: Round the result to two decimal places for consistent records.
- Confirm the source: Check what the area includes before you compare the result with any other listing.
That last step matters more than the arithmetic. Anyone can divide. The investor who checks the area source before trusting the ranking is the one who doesn't mistake a generous measurement for a cheap home.
Choosing the Right Square Footage Measure
Which square footage are you dividing by? Most buyers never ask, yet one home can produce very different figures depending on the area you choose. The visual below shows how the same floor plan feeds different calculations.
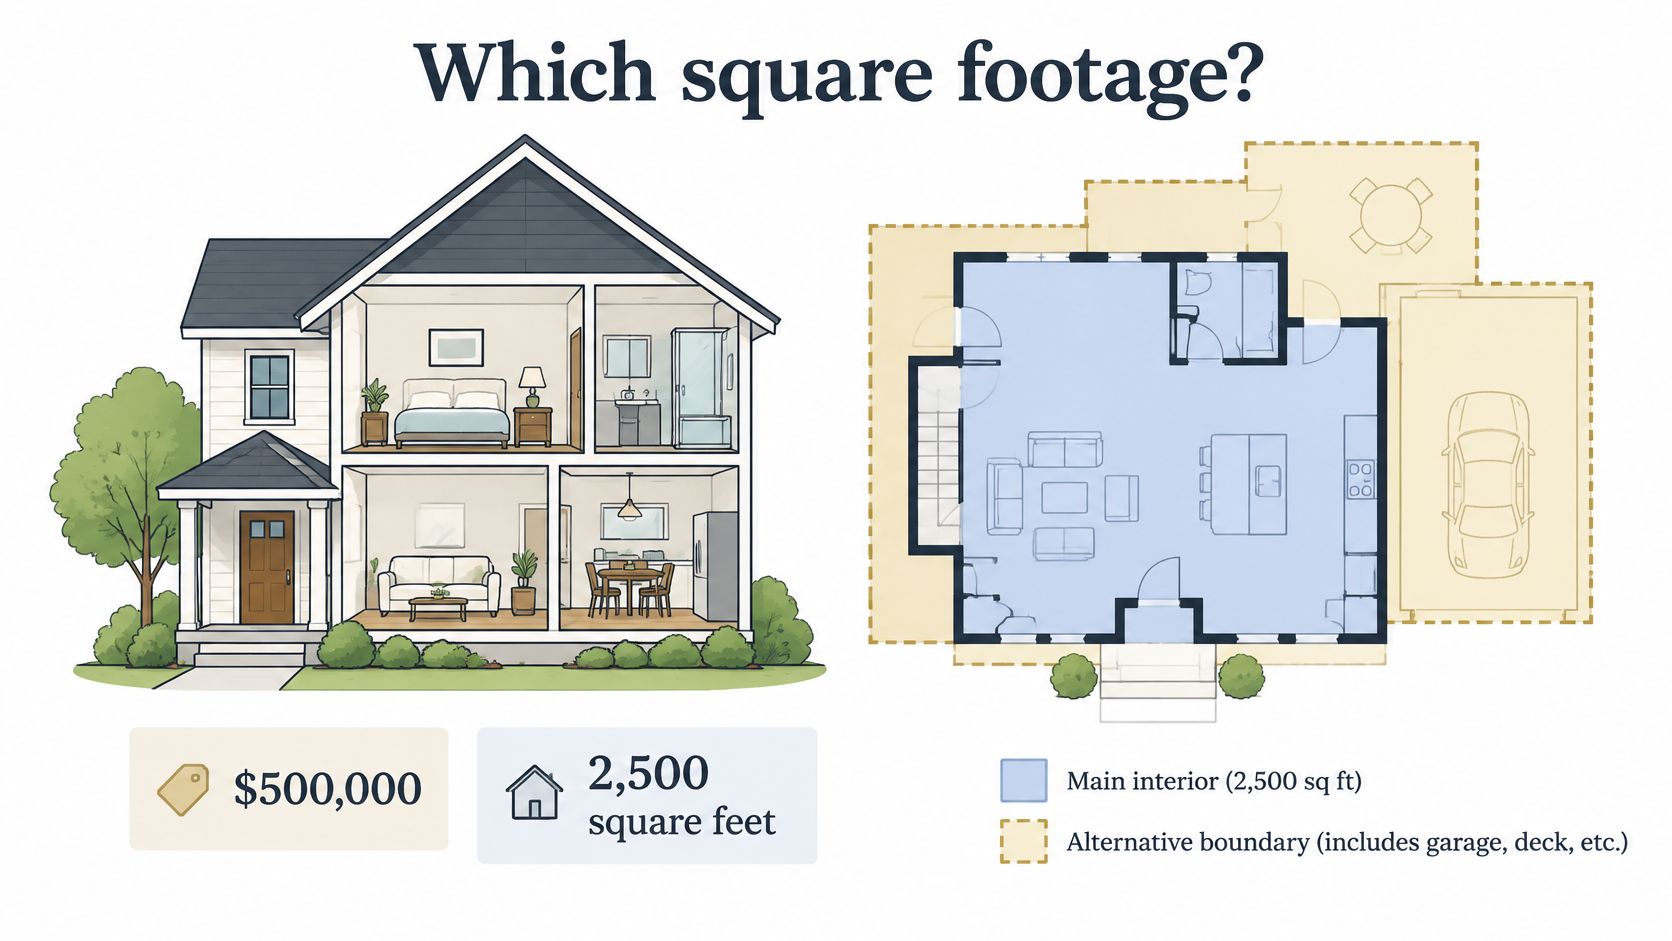
Take a $500,000 home as a worked example. Divide by 2,500 square feet of heated living space and you get $200.00 per square foot. Divide the same price by 2,900 square feet of gross building area and you get $172.41. Nothing about the home changed. Only the denominator did, and the second figure looks cheaper purely because more space was counted.
The residential default is heated and cooled interior living area, which covers bedrooms, bathrooms, closets and hallways. Garages and unfinished basements are usually excluded unless local rules count them, and measurement rules can vary by state or city. Once you move beyond single-family homes, other measures take over, each built for a different purpose.
| Area measure | What it includes | Effect on price per sq ft | Best used for |
|---|---|---|---|
| Heated and cooled living area | Bedrooms, bathrooms, closets and hallways inside the insulated envelope | Lowest denominator, highest figure | Home sales and most MLS-style comparisons |
| Gross building area | Living area plus exterior walls, shared corridors and stairwells | Lower figure than living area | Developer and construction cost comparisons |
| Gross internal area | All enclosed floor space measured inside the walls, including common areas | Mid-range figure | UK and European apartment and office data |
| Net usable area | Space the occupant actually uses | Higher figure than gross measures | Office and retail leasing |
| Rentable area | Usable area plus a share of common areas (the load factor) | Lower figure than usable area | Commercial lease pricing |
| Lot size | Land, not floor space | Not meaningful for building price | Land value analysis only |
The load factor deserves a plain definition. In commercial leasing, it's the share of shared corridors, lobbies and other common areas added on top of the space a tenant occupies to produce rentable area. A larger load factor inflates rentable area and lowers the quoted rate per square foot without changing the total rent.
Watch the lot size trap closely. Land isn't floor space, so it should never enter a building price calculation. A listing that blends lot area into its denominator without making that clear will look dramatically cheaper than every comparable home, but it isn't.
The short video below walks through how these area choices play out on a real floor plan.
Pick one measure and keep it constant across every listing in a comparison. Mixing measures creates false gaps that look like price differences.
Apply a simple test before you include any listing. If it doesn't state its measure, confirm it with the source. If you can't confirm it, drop it from the comparison. A smaller, clean sample beats a larger one built on mixed denominators every time.
Normalizing Prices Before You Compare Them
A low quote can be manufactured by the denominator. Take two listings at the same sticker price: if one counts a covered parking bay and balcony in the measured area and the other excludes them, the first prints a cheaper rate even though the buyer pays for the same floor space. Two price per square foot figures are comparable only when price basis, timing, boundary, sample and area rule match.
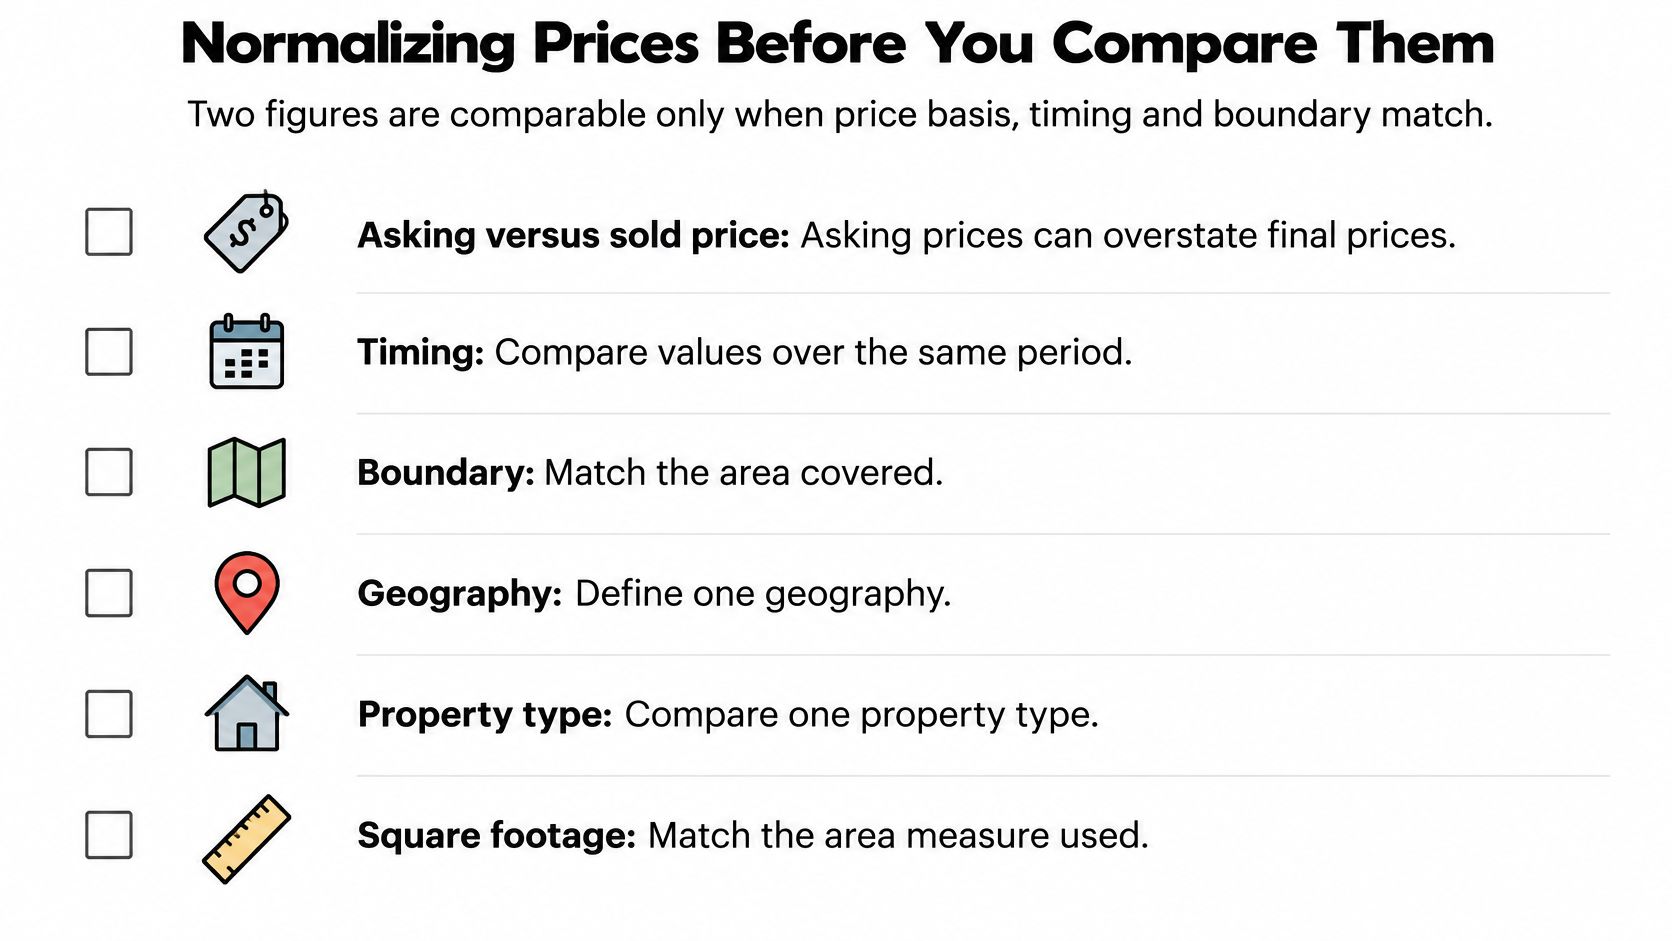
Before ranking anything, write six answers beside the number.
Six Normalization Checks
- Asking versus sold price: Asking prices can overstate final value in cooling markets, while sold prices lag current conditions. Use one basis across the whole set.
- New construction versus resale: New homes and older homes sell into different demand, different finish levels and different warranty expectations. Keep them in separate pools.
- Currency and date: Convert currencies at the rate for the same date, and adjust multi-year series for inflation before calling a change real growth.
- Geographic boundary: A city-centre figure is different from a city-wide average. Define one boundary and hold it fixed.
- Sample and denominator: State whether the figure covers all sales or only selected property types, price bands or portals, and apply one inclusion rule for covered parking, storage and balconies.
- Method changes: A series that changes its rules midstream stops being one series.
Madrid shows the boundary trap in practice. A 2026 comparison reported Madrid at €6,471 per square metre using city-wide asking prices, while the Latin American figures represented city-centre homes, and the source warned this wasn't an equivalent comparison, as covered in Euronews reporting on the Madrid and Latin America housing comparison. Rank those numbers without that warning and you would draw a confident conclusion from two geographies and two price bases.
Method changes break history too. If a statistics office widens a series from new-home sales to sales plus resales, or swaps asking prices for closed prices midstream, points on either side of the break measure different markets. Chart across that break without a note and a methodology revision reads like a price move.
Agents solve a smaller version of this problem when they select comparable sales for a valuation, so it helps to understand how agents estimate property market value before building your own set. If you pull candidates programmatically, an endpoint such as comparable-home records around a target property can supply the underlying listings, while the inclusion decision still sits with you.
A lower price per square foot can come from a wider boundary or a larger denominator, not cheaper housing.
If one answer is missing, leave that figure out of the ranking. Provenance, meaning where the number came from and how it was built, matters as much as the number itself; after that, test affordability separately before treating a low rate as an opportunity.
Benchmark Prices Across Markets and Property Types
Published benchmarks look authoritative, and they are, but only inside their own market, property type and period. Read the table row by row and you'll see the spread is the story.
| Market | Property type | Period | Price per sq ft |
|---|---|---|---|
| United States, national | New single-family homes sold | 2023 median | $154.70 |
| Northeast | New single-family homes sold | 2023 median | $220.95 |
| West | New single-family homes sold | 2023 median | $195.38 |
| Midwest | New single-family homes sold | 2023 median | $156.25 |
| South | New single-family homes sold | 2023 median | $146.64 |
| California | Existing single-family homes | November 2025 median | $423 |
| United States | General and mixed-use commercial | Q2 2025 median | $98 |
| United States | Multifamily properties | Q3 2025 | $144 (up 17.3% year over year) |
Start with the U.S. baseline. The median price per square foot of new single-family homes sold in 2023 was $154.70, across 666,000 single-family houses built and sold that year, with a median sale price of $428,600 and a median size of 2,286 square feet, according to the U.S. Census Bureau summary of 2023 new home sales. The regional medians ranged from $146.64 in the South to $220.95 in the Northeast, which means the national figure describes almost nowhere precisely. A home priced near the national median total can still be priced high or low per square foot depending entirely on where it sits.
Note what that Census measure covers. It's newly built and sold single-family homes, not the entire resale market. That's why the resale contrast is so sharp. California's statewide median price per square foot for an existing single-family home was $423 in November 2025, according to the California Association of Realtors November 2025 sales release. Don't read that as California new-build costing a specific multiple of the national figure. You're looking at a different stock type, a different period and a high-demand state market.
Commercial figures sit in their own world again. U.S. general and mixed-use properties had a median transaction price of $98 per square foot in Q2 2025, according to Altus Group analysis of U.S. commercial real estate transactions in Q2 2025. Multifamily moved the other way on price, with prices up 17.3% year over year to $144 per square foot in Q3 2025, based on Altus Group multifamily data reported by Yield PRO.
How to Read a Benchmark Without Misusing It
Treat each value as a reference range for its own segment, not a target your listing should hit. The largest spreads in the table, new-build against resale and residential against commercial, are exactly the comparisons you shouldn't make directly, because the samples, areas and buyer pools differ.
If you want a structured way to record these figures beside local comparables, you can find a property market analysis template and add columns for property type, period and price basis. For a live view that updates with the market, the RealtyAPI housing market trends data by location lets you track how a local series moves against these fixed historical benchmarks over time.
How to Track Price Per Square Foot Trends From Listing Data
A trend is a series of comparable values over time. One figure is a snapshot. The same figure, calculated the same way every week for the same market, becomes evidence you can act on. Building that series is mostly discipline, and the process below keeps each step checkable.
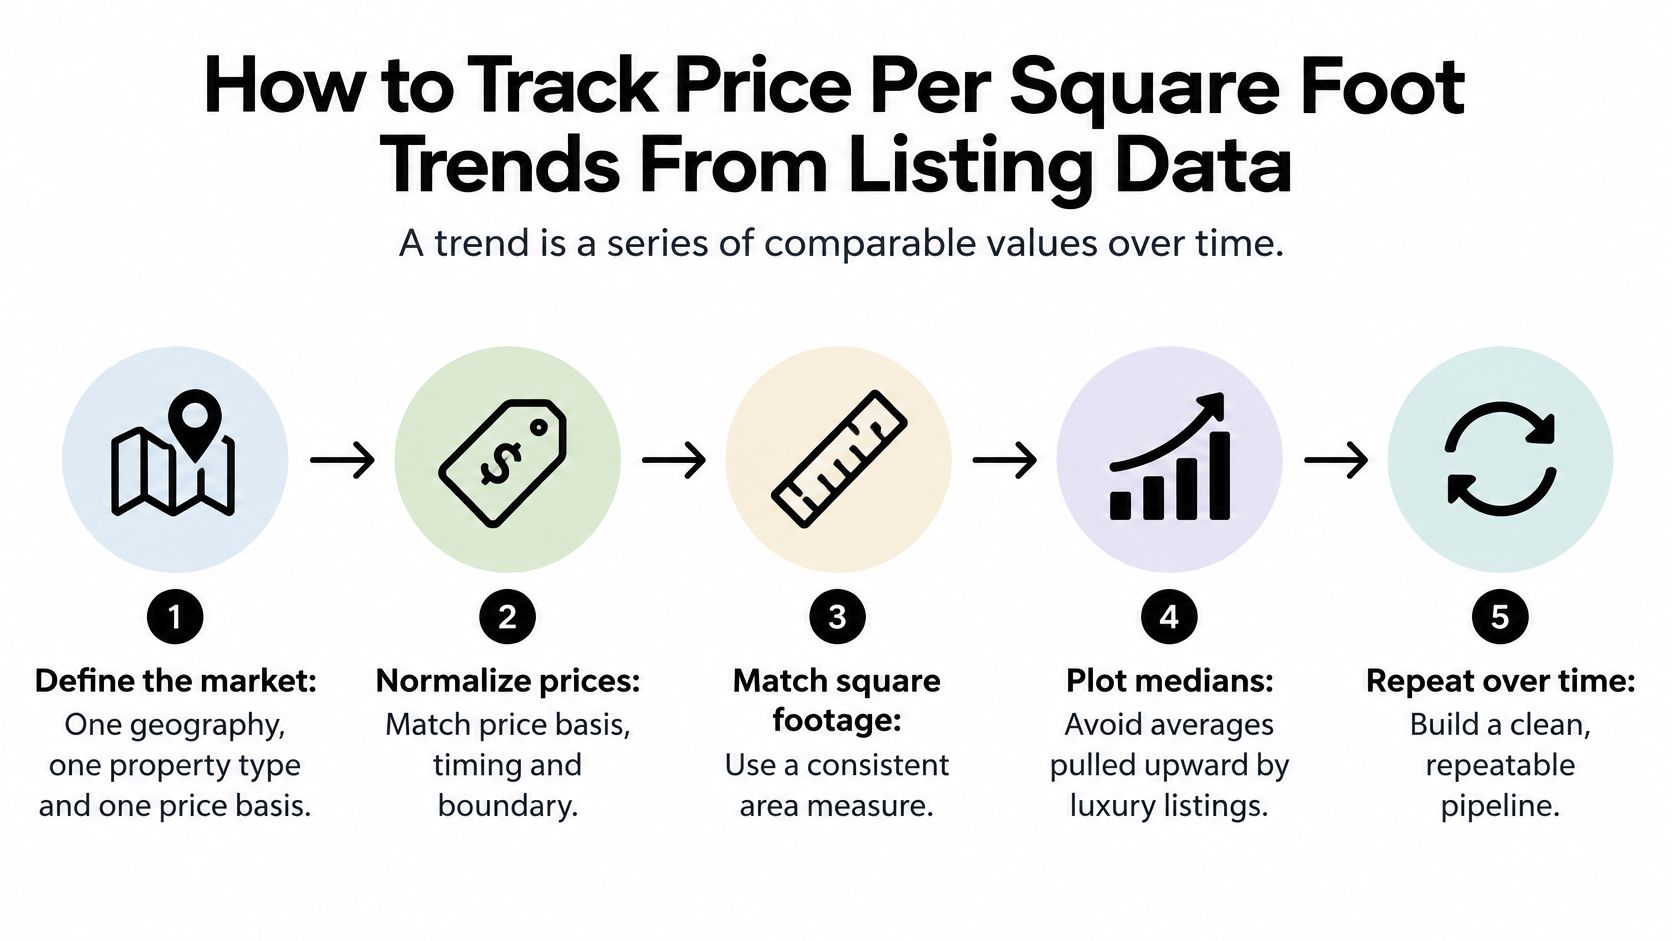
Building the Pipeline Step by Step
- Define the market first. Fix one geography, one property type and one price basis, asking or sold, before you pull a single record, because changing any of the three later restarts your series.
- Pull listings on a schedule. A listing data API such as RealtyAPI.io gives you records to collect on a fixed cadence; store the pull date with every record so each period stays reproducible. A weekly pull is frequent enough for most residential trend work.
- Clean before you calculate. Remove records without floor area, drop duplicates, and convert square metres to square feet by multiplying by 10.764, since one square metre is 10.764 square feet. The conversion matters in practice because official UK data is published per square metre, as in the ONS price per square metre estimates for England and Wales, while most US-facing tools report per square foot.
- Calculate at listing level. Divide each listing's price by its area. Keep the listing-level values, because you'll need them for medians, percentiles and outlier review.
- Trim outliers deliberately. As a working rule, keep values between the 35th and 65th percentiles for the trend line and review the rest by hand. Treat that band as a choice you document, not a standard. Published feeds make their own cleaning and smoothing decisions; the Parcl Labs price feed whitepaper is one example of a methodology that states them openly, and its choices need not match yours.
- Aggregate with the right average. For listings in a period, use the median, the middle value when all values are sorted, because extremes distort it less. For groups of sold commercial properties, divide total sale prices by total square footage rather than averaging each property's ratio, as set out in NAIOP research on evaluating commercial real estate markets. That weighted figure reflects where the money traded.
- Smooth the series. Apply a 7-day or 30-day rolling median, which recomputes the median over a moving window, to reduce short-term noise from thin daily samples.
- Automate updates. Use webhooks, automated notifications sent when new data arrives, for new-listing alerts so the series updates without manual pulls. Compare each new value with the prior baseline instead of reacting to single listings.
Long-run series show why this discipline pays. The same ONS series runs continuously from 1995, long enough to hold several full market cycles, and it only stays meaningful because the calculation stays fixed. Change the floor area measure or the transaction filter halfway through, and the early years stop matching the later ones.
To add depth to a current series, pair live listings with historical records from the RealtyAPI price history data for individual properties, which helps separate genuine repricing from fresh inventory entering the sample.
Why platforms disagree: Two services can report different current figures for the same market because their trimming and smoothing choices differ. The market didn't move twice. The methods did.
Document your percentile band, your smoothing window and your price basis alongside the series. Six months from now, that note is the difference between a trend you can defend and a line you can't explain.
Charts for Reading Price Per Square Foot Trends
Each chart answers one question, so choose the chart by the question you're asking. A dashboard that plots everything usually answers nothing clearly.
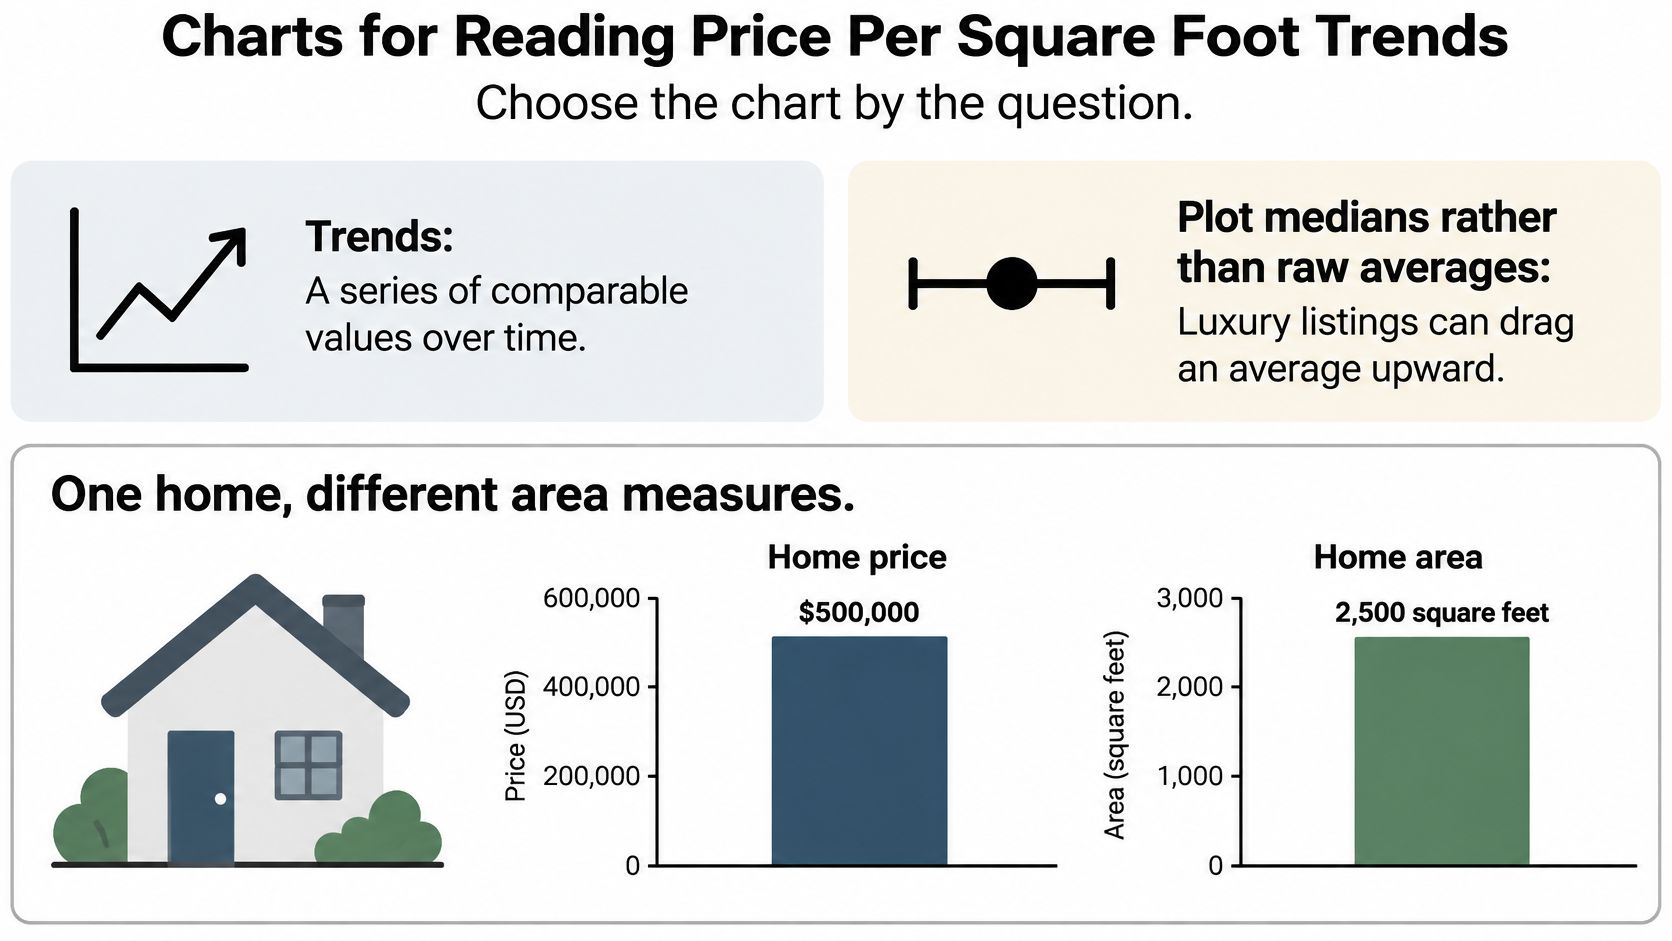
Plot medians rather than raw averages. A handful of luxury listings can drag an average upward even when most homes haven't changed price at all. The median ignores how extreme the extremes are and reports the middle of the market, which is what most buyers and sellers face.
| Chart | Question it answers | What to plot | Watch for |
|---|---|---|---|
| Line chart | Is the market rising or falling? | 30-day rolling median with 35th-65th percentile band | Gaps in the series after data outages |
| Bar chart | Which areas cost more per square foot? | Median by neighbourhood, labelled with sample size | Bars built on very small samples |
| Scatter plot | Do smaller homes cost more per square foot? | Floor area on the x-axis, price per square foot on the y-axis | Outliers stretching the axis |
| Mix check | Is the change real or a shift in home sizes? | Median price per square foot beside median total price | Totals moving while the per-foot median holds steady |
| Map | Where do the highest values cluster? | Shaded regions by median price per square foot | Shading on unequal boundaries |
The line chart carries your 30-day rolling median with a shaded band between the 35th and 65th percentiles. The line shows direction, and the band shows spread, so a narrow band tells you the middle of the market is tightly priced while a widening band warns you that listings are dispersing. A bar chart then compares neighbourhoods or regions, and labelling each bar with its sample size stops a three-listing neighbourhood from looking as solid as a three-hundred-listing one.
A scatter plot puts floor area on one axis and price per square foot on the other. It typically shows smaller units carrying higher unit prices, because kitchens, bathrooms and land costs spread over fewer square feet. A dashboard of averages hides that pattern completely. The map shades regions by median price per square foot so you can see where high values cluster and whether expensive pockets border cheaper ones worth investigating.
The Mix Check That Catches False Moves
Plot median price per square foot beside median total price. The per-foot median is more stable when the mix of homes sold changes, since larger homes sell for higher totals without necessarily commanding higher unit prices, as explained in Texas Real Estate Research Center analysis of median price per square foot. If totals climb while the per-foot median holds steady, bigger homes are selling, not pricier space.
Label the time window and price basis on every chart. Then ask three questions in order. Is it rising? Where is it rising? Is the change real, or is it a mix effect? A chart that survives those three questions has earned its place in a decision.
Check Affordability Before You Act on a Low Price
A low price per square foot isn't proof of affordability. Mumbai makes the point sharply. A 2026 global comparison found Mumbai's price per square metre was nearly 50% below Sydney's, yet average income was more than 80% lower, according to Forbes Australia ranking of the world's most expensive cities for housing in 2026. Space was cheaper. Buying it on local earnings was harder.
Regional variation compounds the problem. Inside a single country, secondary markets can appreciate faster than the capital even while their prices sit far lower, so a market that looks cheap on unit price today may not stay cheap through your holding period. Across borders the pattern repeats: low unit prices frequently coincide with low local wages. A ranking that sorts markets by price per square foot alone is measuring the wrong thing for an owner-occupier, and only half the right thing for an investor, because achievable rents depend on what local households earn.
Running the Affordability Check
- Pick a typical unit size for your buyer or renter. The worked example below uses 900 square feet.
- Multiply by the local unit price. At $250 per square foot, that gives 900 × $250 = $225,000 as the example purchase price.
- Divide by median household income. Against a $75,000 income, the ratio is 3.0, meaning the example home costs three years of typical earnings.
- Add the full cost of living there, including mortgage costs or rent, taxes and utilities, because the purchase price is only part of occupancy cost.
- Compare ratios across markets instead of ranking by price per square foot alone.
You can run the earnings side quickly with the RealtyAPI affordability calculator for estimating a sustainable home budget, then set the ratio beside your unit-price ranking. Price per square foot identifies physical scarcity, meaning how intensely space itself is priced. The income-adjusted ratio identifies who can afford that space. A low figure earns a place on your shortlist only after both numbers check out.
If you're building price per square foot rankings, trend dashboards or affordability checks, RealtyAPI.io gives you listing prices, floor areas and market data through one API so you can calculate and normalize the metric yourself instead of trusting a portal's version. Test your pipeline on a handful of listings first, verify the denominators, and then scale it with confidence by visiting RealtyAPI.io.