Market Trend Analysis Example for Real Estate Data

You're probably staring at a dashboard that says prices are up, listings are moving, and demand still looks decent, yet your gut says the market feels different than it did a few months ago. That's the exact point where a simple line chart stops being useful. In real estate, especially when you're feeding pricing tools, lead scoring, acquisition models, or investor alerts, the hard question isn't whether a line slopes upward. It's whether the move is still healthy or already tiring out.
A good market trend analysis example has to answer that in operational terms. It should help a brokerage decide where to push inventory, help a marketplace decide which ZIP codes need fresher comps, and help an investor decide whether rising values still justify tighter yields. That means working from live data, cleaning it, smoothing it, stress testing it, and turning it into rules a team can use.
Why This Market Trend Analysis Example Matters Now
Monday morning, a metro dashboard still shows rising median sale price. By Thursday, operators are asking a different question because new listings are piling up, price cuts are spreading, and homes that sold in a week last quarter are now sitting through a second weekend. That gap between the headline chart and field behavior is where trend analysis starts to matter.
A real estate trend call has to survive messy conditions. Late listing updates, duplicate records, stale status changes, and uneven county coverage can all make a market look stronger than it is. Teams that rely on one upward price line usually catch the turn late.
The practical question is not whether the market moved. It is whether the current move still has confirmation from the signals that usually travel together. In housing, healthy continuation often shows up as price resilience, stable or improving absorption, and inventory that is not expanding faster than demand. Exhaustion looks different. Prices may still drift up while time to sale stretches, concessions rise, and pending volume loses momentum.
That is why a single end-to-end market trend analysis example matters now. The useful version does more than plot history. It starts with live extraction, cleans listing and transaction records that do not line up neatly, builds a trend signal that can handle weekly noise, and ends with an alert a pricing or acquisitions team can use.
I have found that combining transaction activity with supply-side friction is what separates a decent chart from an operational signal. For real estate specifically, I like pairing sales and inventory movement with valuation and listing velocity metrics. If values keep rising but velocity weakens and active supply expands, that is usually not continuation. It is a market losing alignment.
Academic work on housing cycles points in the same direction. The Federal Housing Finance Agency publishes repeat-sales house price measures that are useful for long-run direction, but those indexes move too slowly on their own for day-to-day operating decisions, as shown in the FHFA House Price Index methodology and data. The National Association of Realtors also tracks inventory, median days on market, and sales pace because price alone misses how quickly buyer demand is clearing supply, as reflected in its existing-home sales data resources.
That trade-off matters in production. Price series are cleaner and easier to explain. Market turns often show up first in inventory pressure, pending lag, and slower listing movement, which are harder to normalize but far more useful if the goal is to catch continuation versus exhaustion before the monthly recap does.
Practical rule: If price, inventory, and speed stop agreeing, treat the trend as suspect until the cross-signals line up again.
Defining Your Question and Choosing What to Measure
At 8:15 on a Monday, an acquisitions lead asks a simple question: should we keep bidding harder in this ZIP, or is the run already tiring out? That is the point where market trend analysis either helps the business or wastes a week.
A useful analysis starts by pinning down one decision, one geography, and one review window. If those three stay loose, teams end up mixing long-cycle valuation questions with short-cycle operating signals. That is how you get a chart that looks polished and still fails the meeting.
Start with the decision, not the dataset
For this real estate example, the working question is narrower than "is the market up?" A better version is: are rising prices in this submarket still supported by demand and absorption, or are we looking at late-stage strength that is already losing participation?
That framing changes what gets measured. It also keeps the workflow honest. I have seen teams pull twelve fields because the API made them available, then back into a story after the fact. In production, that usually creates noisy joins, weak definitions, and alerts nobody trusts.
These are four decision types worth separating early:
Pricing
Should list prices keep moving up, or has buyer resistance started to show up in slower movement?Inventory
Are fresh listings clearing cleanly, or is supply beginning to stack up?Rental buy box
Do current prices and rents still support the hold strategy, or are returns thinning out?Market selection
Which submarkets are showing broader confirmation than the metro headline?
Choose measures that can confirm or reject the trend
For continuation versus exhaustion, I would not stop at price. Price is the headline metric, but it lags market stress more often than operators want to admit.
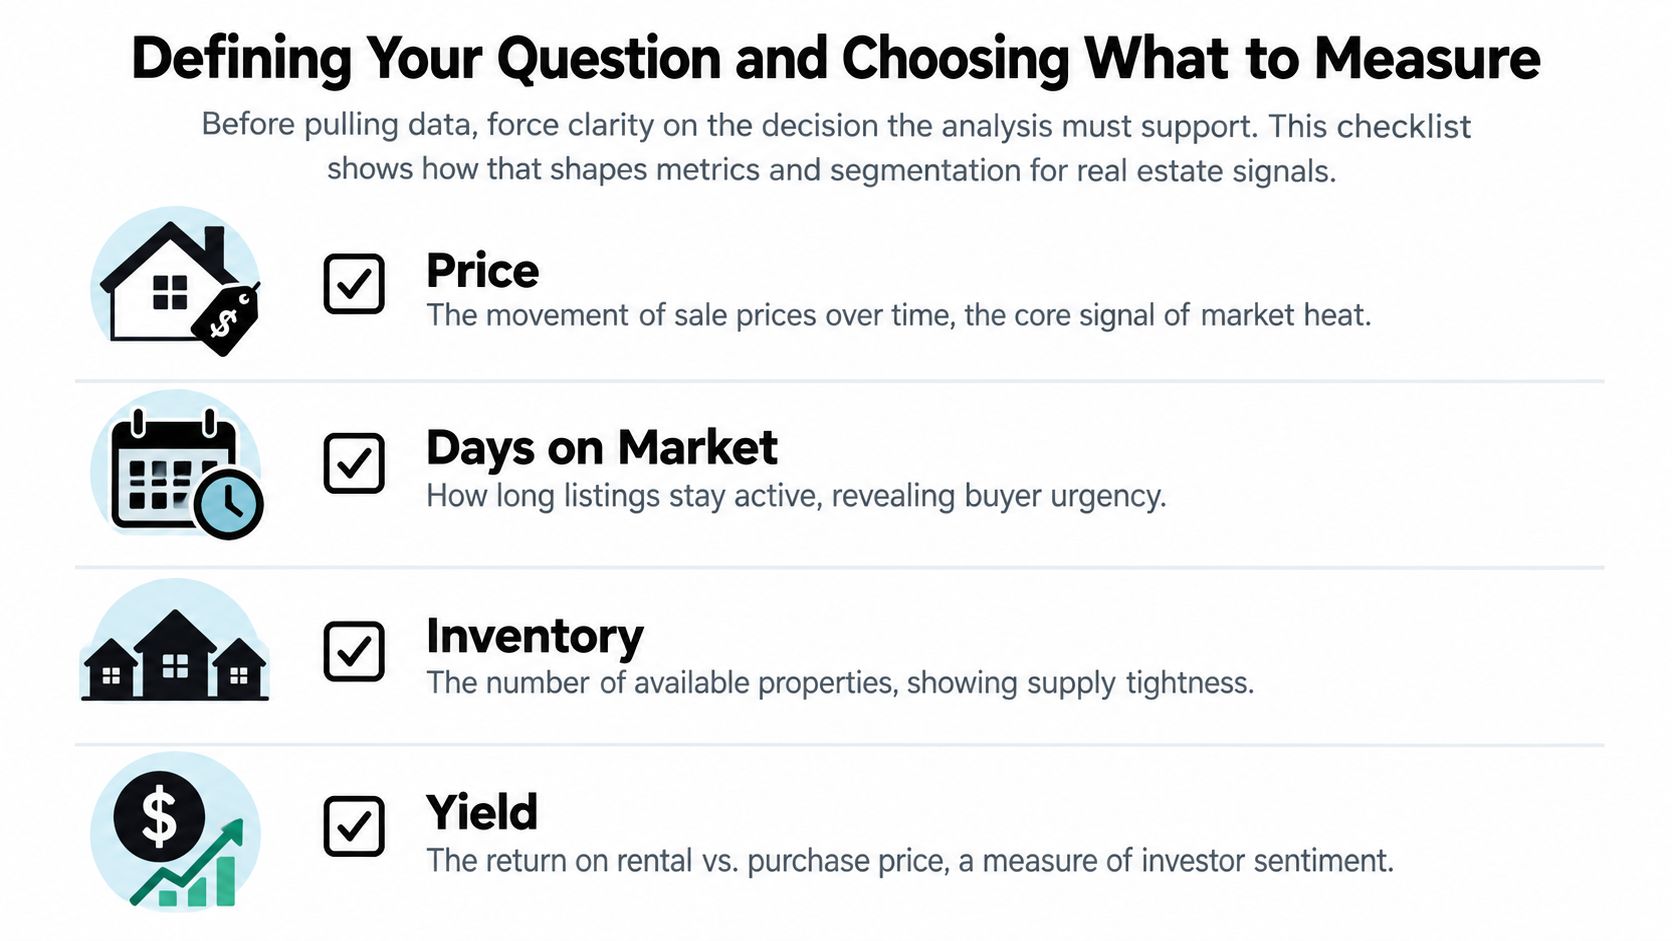
Use a tight set of measures that answer the question directly:
- Price trend for direction and valuation pressure
- Days on market for buyer urgency and friction
- Active inventory for supply pressure
- Pending or contract pace for whether demand is still meeting new supply
- Yield or rent-to-price relationship if the use case includes investors
That mix works because each metric covers a different failure mode. Prices can rise while days on market drifts up. Inventory can expand while median price still prints strong because the best homes cleared first. Yield can compress long before resale buyers notice. Healthy continuation usually shows agreement across multiple signals. Exhaustion usually starts with disagreement.
If you need a benchmark input for home value direction, the ZHVI housing market endpoint can serve as one standardized series alongside your listing and transaction feeds.
Segment before you analyze
A metro average is rarely the unit that matters operationally.
Segment the market before the first pull, not after the first chart:
- Geography such as ZIP, neighborhood, corridor, or school zone
- Property type such as condo, detached, two-to-four unit, or build-to-rent
- Price tier because entry-level and upper-tier inventory often behave differently
- Buyer or owner cohort such as investor-heavy stock, first-time-buyer product, or luxury resale
A lot of trend work breaks here. Analysts use one boundary for pricing, another for inventory, and a third for lead flow because each source names places differently. Then the "trend" is partly real and partly a mapping problem. Write the segment rules down first. Keep them fixed long enough to compare periods cleanly.
A practical scoping checklist
Before any extraction starts, make sure the question can survive contact with messy market data:
- State the decision in one sentence.
- Set the observation window such as weekly for operating alerts or monthly for market reviews.
- Pick no more than five primary measures.
- Define the segment keys the same way across every source.
- Add a disconfirming metric that can tell you the apparent trend is weakening.
- Decide what action follows if the signal points to continuation versus exhaustion.
That last point matters. If no pricing change, buy-box shift, or alert threshold depends on the answer, the analysis is still too vague.
Pulling and Preparing Real Estate Data Without the Mess
Monday at 7:30 a.m., an ops lead sees a spike in active listings for one ZIP and asks whether demand just softened. Before anyone changes pricing or flags the submarket, the first job is to verify the pipeline. In real estate, a one-week jump often comes from duplicate relists, delayed status updates, or a boundary mismatch between search methods.
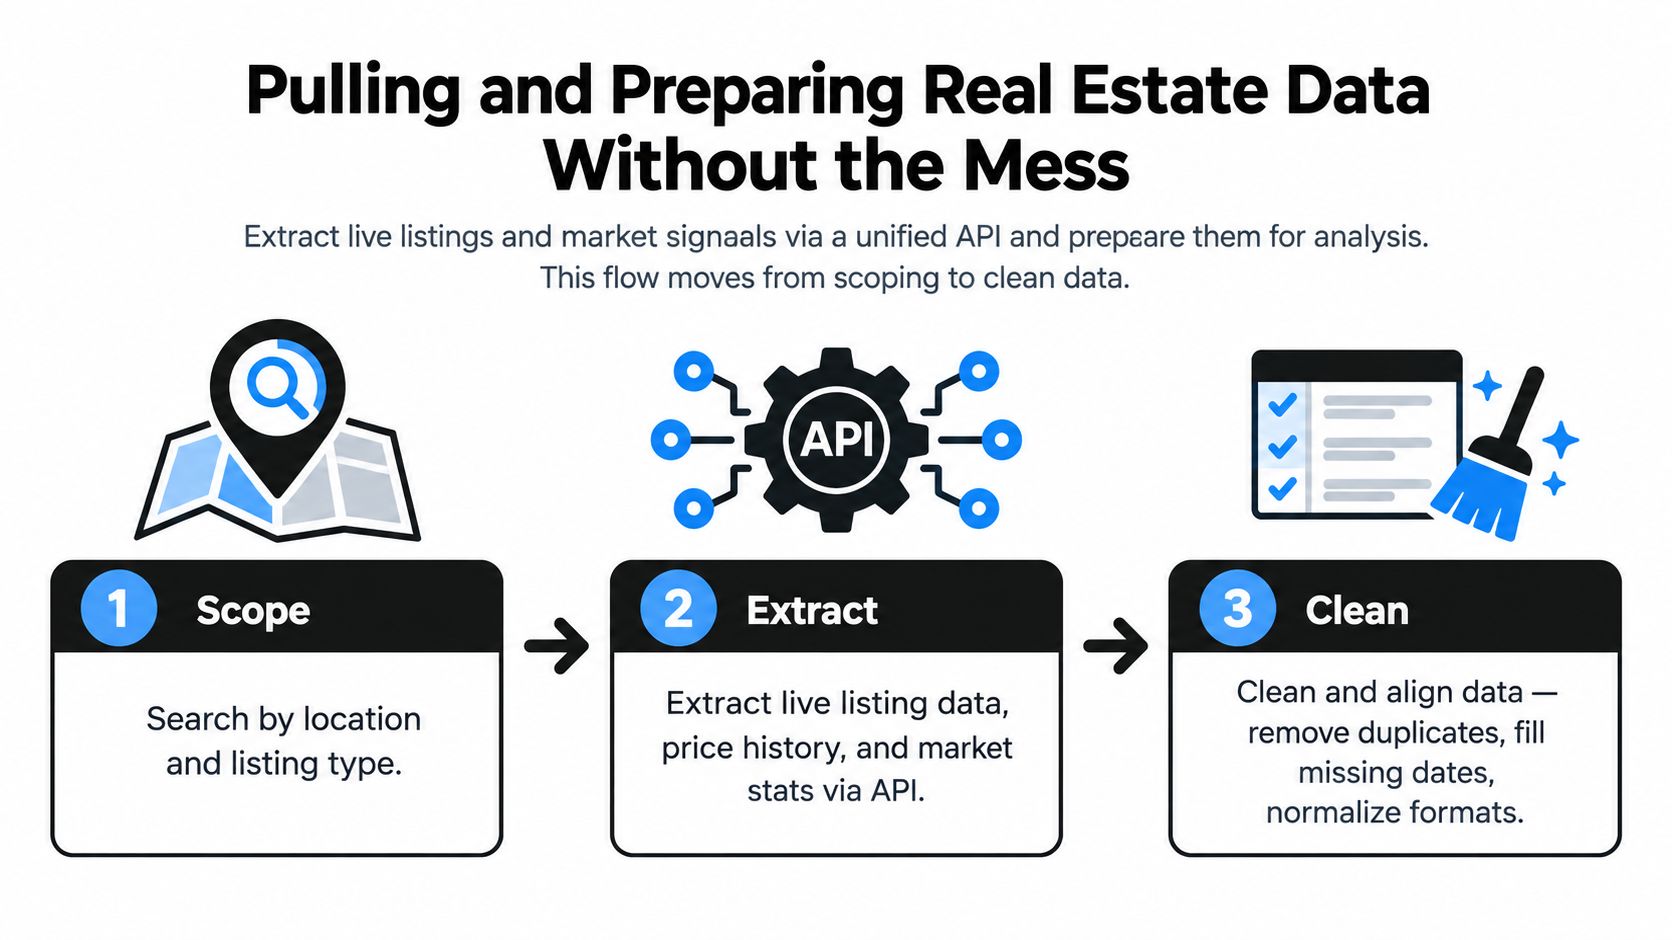
Pull the same market from more than one angle
I treat location retrieval as a validation problem, not just a query problem. If the same neighborhood only exists as free-text input, the series will drift as soon as one source renames it or redraws a boundary.
The retrieval patterns that hold up best are:
- Destination search for city, neighborhood, or named area workflows
- Coordinate search for map-based products and viewport analysis
- Place ID search when another service has already normalized the geography
- URL-based extraction when acquisition or research teams start from listing pages
Using more than one search pattern makes it easier to catch bad joins early. If a polygon pull says inventory rose but a place-ID pull for the same area does not, I check coverage and mapping before I call it a market move.
For teams testing request shape before they wire a production job, the RealtyAPI API playground for search payloads and response validation is useful because it exposes the response structure before you commit to a schema.
Normalize early or your trend series will drift
Raw JSON does not belong in a trend chart. It needs a canonical model with stable definitions that survive refresh cycles, source changes, and relists.
At minimum, normalize these field groups:
| Field group | What to standardize | Why it matters |
|---|---|---|
| Listing identity | source ID, canonical ID, address fingerprint | prevents duplicate counts across refreshes |
| Time fields | list date, update date, scrape date, off-market date | keeps weekly and monthly series aligned |
| Pricing | list price, prior price, rent, currency, unit basis | removes false volatility from unit mismatches |
| Geography | lat/lng, postal code, neighborhood label | keeps segment rules stable |
| Property facts | beds, baths, area, type, status | makes filters and cohort cuts reliable |
Identity resolution usually decides whether the trend is believable. A listing can change brokerage, URL, photos, or status while still representing the same unit. If the pipeline treats each change as a new record, active inventory rises on paper while nothing changed on the ground.
That failure mode is common.
Clean the mess before you compute anything
My cleaning pass is designed to protect the signal, not to make the table look tidy. Real trend work breaks when stale records remain active, pending listings stay mixed into supply, or one parsing error creates a fake luxury comp that skews median price.
The minimum pass usually includes:
- Duplicate collapse using source ID plus address fingerprint, with rules for relists and edited records
- Missing-date repair so sparse updates do not create artificial gaps in daily or weekly counts
- Status normalization that separates active, pending, off-market, removed, and sold states cleanly
- Outlier review for unit swaps, decimal errors, impossible square footage, and malformed prices
- Window alignment so listing, rental, and valuation series are compared on compatible dates
I also keep a rejection log. If a feed starts sending malformed prices or blank status values, the team needs to see what was excluded and why. Silent cleanup makes alerting fragile because nobody can tell whether a trend changed or the parser dropped half the records.
A separate technical reference on market trend workflows makes the same practical point. Forecasting methods only help after duplicate, missing, and outlier problems are under control, and trend estimates should be checked against independent signals such as status changes or comparable series, as described in this technical benchmark.
Keep the pipeline fresh enough for alerts
Freshness is part of data quality. If listing status changes arrive two days late, the alert may be mathematically correct and still operationally useless.
A workable setup usually includes:
- Scheduled pulls for slower-changing aggregates such as area summaries and historical value series
- Webhook-driven refreshes for listing updates, new inventory, and status transitions
- Retry logic with exponential backoff for temporary source failures
- Schema monitoring so field changes are caught before they contaminate downstream metrics
RealtyAPI.io can fit into that setup because it exposes listing and market data through REST, GraphQL, and webhooks. That matters when the goal is one ingestion pattern for listings, prices, and market signals, instead of maintaining separate collectors and separate failure modes for each source.
Smoothing Noise and Modeling Direction With Proven Methods
A raw line chart can manufacture trends that are not there. I have seen a submarket look hot on Monday because a batch of stale listings finally cleared, then look weak on Wednesday after a delayed price update landed. If the goal is to decide whether momentum is broadening or burning out, smoothing choices matter as much as the source data.
Start with methods you can defend in a review
For a real estate market trend analysis example, simple methods usually hold up better than complex ones because the failure modes are easier to spot.
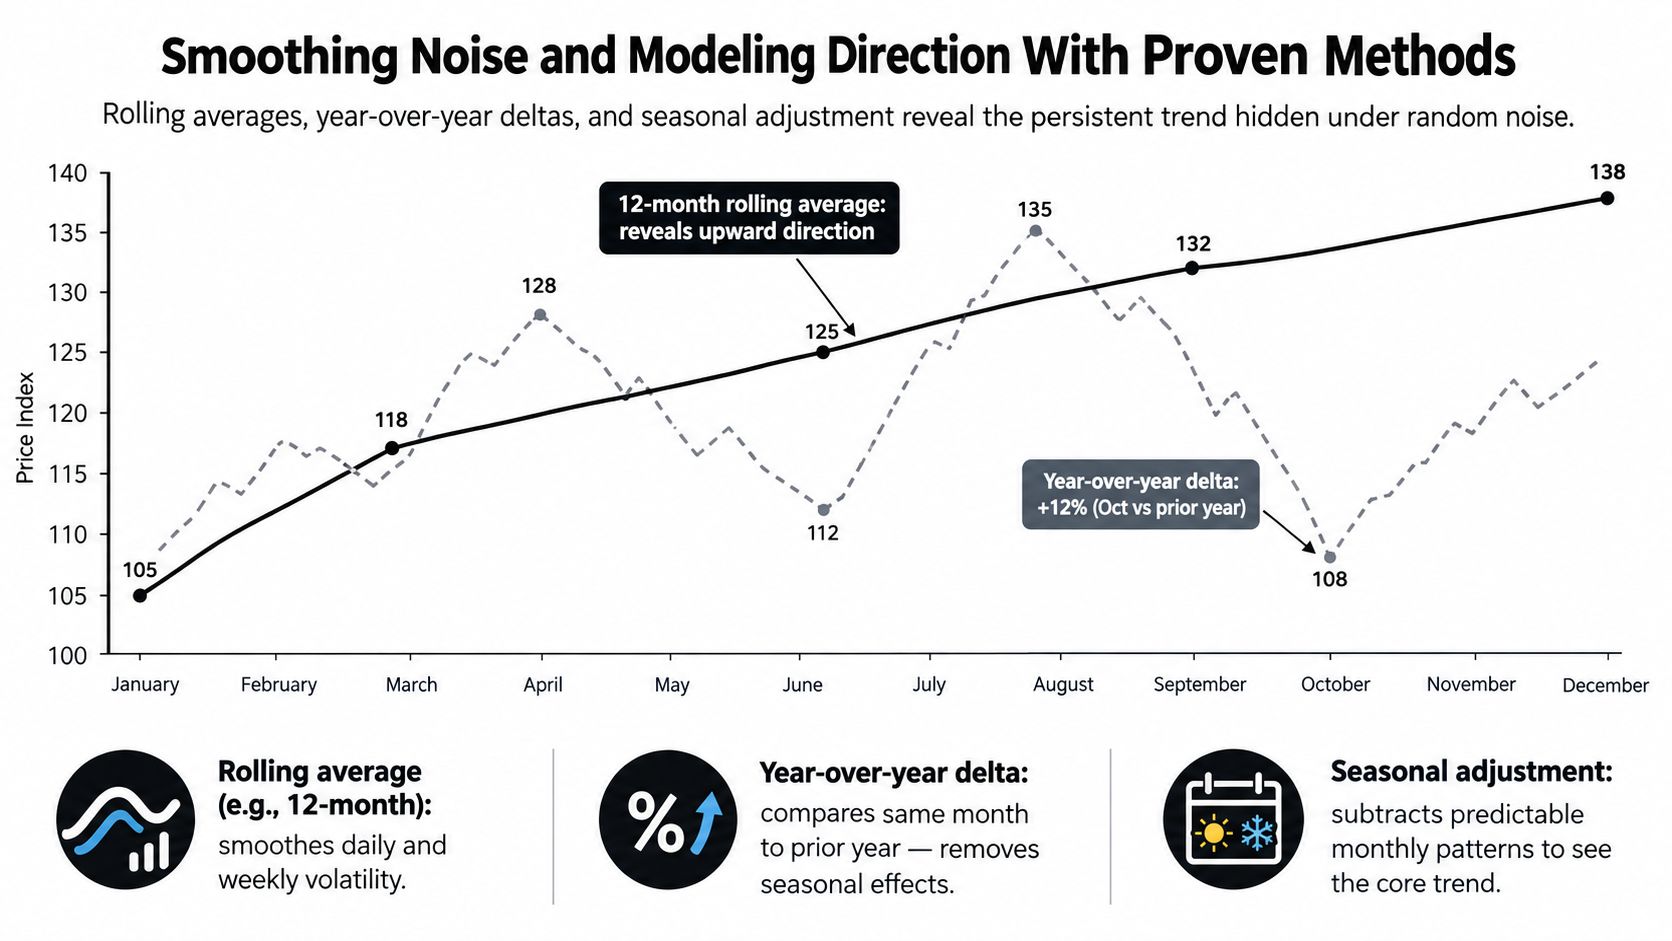
- Rolling averages reduce day-to-day listing noise. I usually use shorter windows for inventory and status activity, and longer windows for price series that update less consistently.
- Year-over-year deltas control for seasonality without pretending seasonality is identical every month. They work well for median list price, new listings, and pending activity.
- Regression slopes turn a moving series into a directional score. That helps when ranking ZIP codes or deciding which submarkets deserve alerts.
The trade-off is lag. A longer rolling window gives a cleaner line, but it reacts late when a market turns. A shorter window reacts faster, but it will overstate noise in areas with thin listing volume. There is no universal setting. Pick windows based on transaction density, update frequency, and how quickly the team needs to act.
For home-level value history or a comp set, Zestimate history and home values can serve as one input series. It still needs smoothing and context before it becomes a trend signal.
Separate direction from calendar effects
A spring jump in listings is not the same thing as a structural supply shift. A holiday slowdown in days on market is not automatically a demand surge. Decomposing the series keeps those effects apart so the trend label reflects market direction instead of the calendar.
| Component | What it captures | Typical real estate example |
|---|---|---|
| Trend | persistent movement over time | rising home values across several months |
| Seasonality | repeating calendar effects | spring listing surges |
| Residual | unexplained variation | one-off shocks, bad records, event noise |
That decomposition pays off fast in alerts. If median price rises while the seasonal component is doing most of the work, I treat the move differently than a rise supported by the underlying trend component.
Use forecasting only after the trend signal is stable
For short-to-medium horizon work, exponential smoothing and ARIMA are still practical because they force clear assumptions about persistence, seasonality, and error structure. They also fail in readable ways. If the forecast breaks after a schema change or a burst of outliers, the team can usually trace the problem without guessing what a black-box model decided.
The historical roots of that discipline run deep. Researchers studied daily NYSE stock data from February 17, 1885 to July 2, 1962 and used the Box-Jenkins ARIMA approach through model identification, estimation, and confidence-interval testing to examine dependence over time. That 77-year daily dataset is a reminder that serious trend work relies on long samples and formal testing, not one good-looking quarter, as summarized in this historical market cycles reference.
A quick explainer helps if your stakeholders need a visual refresher before signing off on method choices.
Write down the settings that change the answer
Trend models break during handoff when nobody knows which assumptions drive the label.
Document:
- Window lengths for rolling averages and slopes
- Seasonal treatment by metric
- Forecast horizon the team trusts
- Outlier handling and whether review is manual or automatic
- Regime definitions used in dashboards and alert thresholds
Modeling note: If the team cannot explain why a trend label changed, the problem is usually in the assumptions, not in the market.
Reading the Real Estate Example and Spotting When Trends Fade
A familiar failure case looks like this. Median list price in one ZIP keeps climbing, the dashboard stays green, and someone calls it momentum. Two refreshes later, showing activity is down, days on market has started drifting up, and new listings are no longer getting the same response. The line never stopped rising. The trend still weakened.
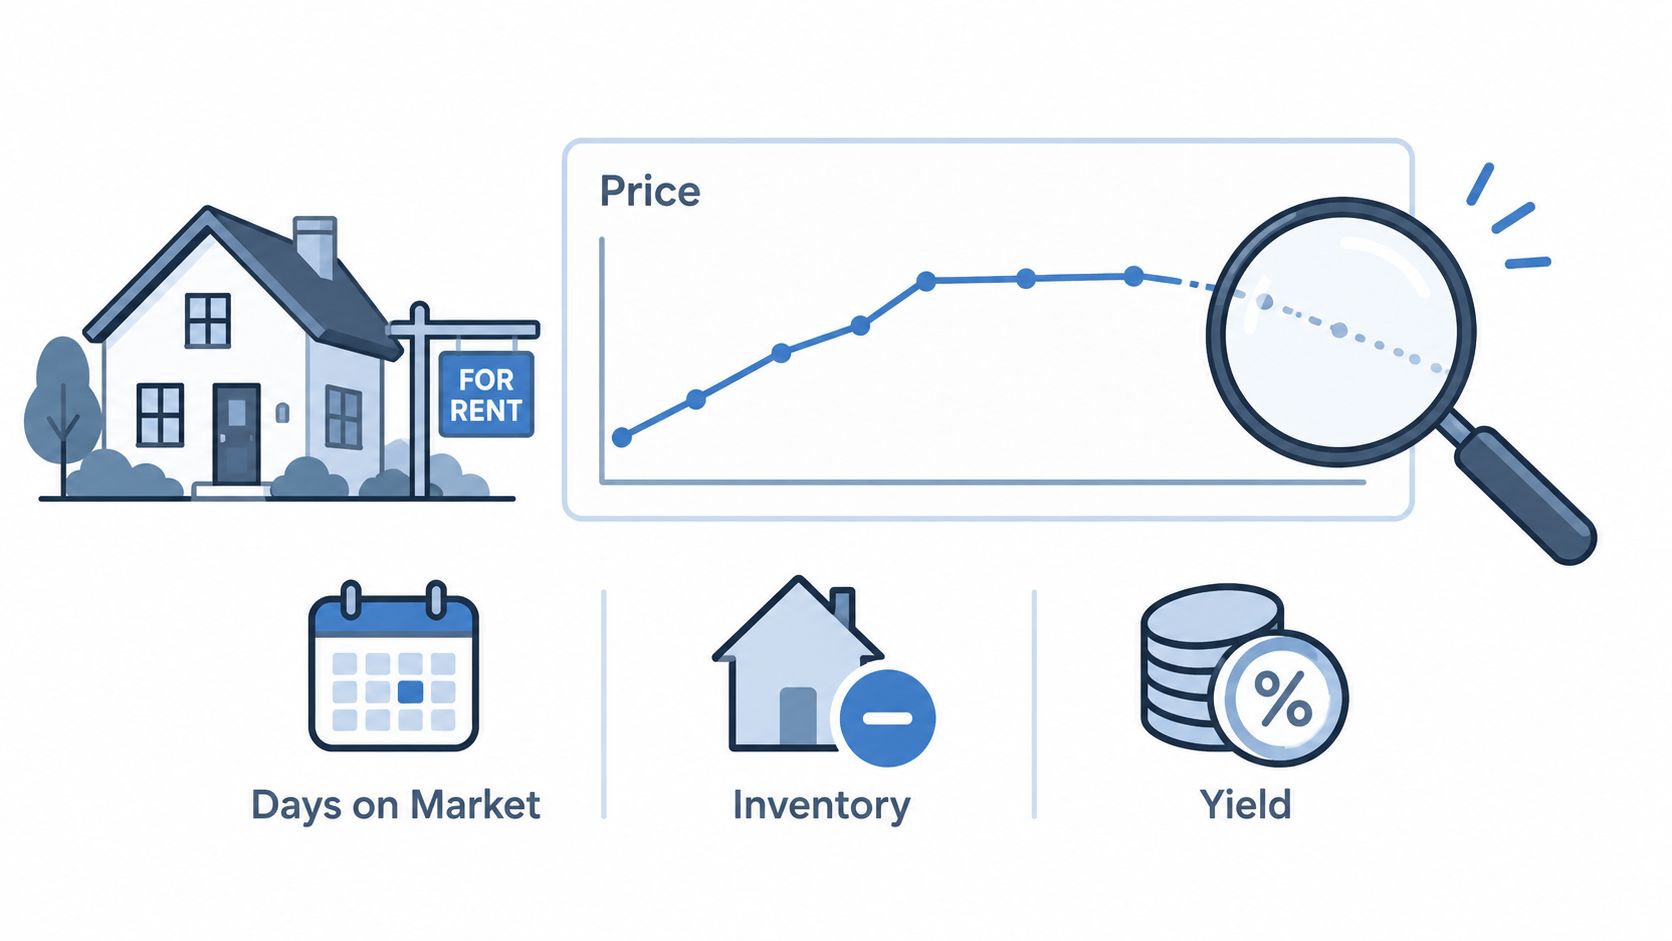
That is why interpretation matters more than the chart itself. In this real estate example, the job is not to admire price appreciation. The job is to decide whether buyer demand is still carrying the move, or whether price is lagging behind a market that has already started to lose participation.
What healthy continuation looks like
A healthy continuation usually has confirmation from more than one operating metric. Price can lead for a while, but it should not stand alone for long.
I read the market in this order:
- Check the smoothed price path and its slope.
- Compare it with transaction velocity proxies such as days on market.
- Look for supply pressure in active inventory and new listing flow.
- Recheck yield compression to see whether investor demand still has room.
The pattern matters more than any single point. In a strong submarket, prices rise steadily, days on market stay stable or improve, inventory stays constrained or loosens slowly, and yields compress at a pace buyers can still underwrite. Small disagreements happen every week. A healthy trend absorbs them.
Price without confirmation deserves skepticism.
What exhaustion looks like in practice
Late-stage trends often get mislabeled because the headline metric still looks strong. In property data, exhaustion usually shows up as acceleration that loses support underneath.
A practical way to read it:
| Signal pattern | Continuation reading | Exhaustion reading |
|---|---|---|
| Price | steady climb with broad support | sharp step-up after a long run |
| Days on market | flat or improving | starts rising while prices still rise |
| Inventory | stable or easing gradually | builds faster than recent baseline |
| Yield | compressed, still workable | compressed enough to weaken buyer appetite |
Market technicians have a long history of separating breakaway, runaway, and exhaustion moves. The same logic is useful here even though housing does not trade intraday. Price spikes near the end of a run often look strongest right before conviction fades. For a clean explanation of exhaustion-gap behavior and why late acceleration can mark a move near completion, IG's overview on exhaustion gaps is a useful reference.
One metric will not settle the call. The cluster will.
I would not mark a market as exhausted because it is expensive. I would mark it as exhausted when price keeps printing strength after turnover, listing speed, or investor economics have already started to soften.
Use context before you fire the alert
Context keeps teams from overreacting to one noisy refresh. A school-district boundary change, a tax-policy headline, or a one-week burst of relisted inventory can distort the picture without changing the underlying direction.
Three checks usually prevent bad calls:
- Timing check. Did the divergence persist across more than one refresh cycle?
- Geography check. Is the weakness broad across the submarket, or isolated to one pocket or property type?
- Participation check. Are buyers still transacting at the same speed, or are sellers marking prices up into thinning demand?
If the answer points to isolated noise, hold the label. If the answer points to repeated divergence, treat it as a regime shift candidate and route it for review. Tools such as AnomalyTrendsDashboard help with that inspection step because teams can see whether the break came from one anomalous batch, one neighborhood, or a broader loss of confirmation.
Good trend reading is less about calling every turn early. It is about waiting for enough evidence that operations can act on it with confidence.
Putting Trends to Work With Alerts Tips and Next Moves
A trend model starts paying rent when it changes an operating decision. In this real estate example, that means the pipeline does more than chart median price and inventory. It pushes a review to the pricing lead when demand is thinning, flags acquisitions when rent support slips, and stays quiet when a one-cycle wobble is just feed noise.
Turn trend logic into alert rules
Alert rules should map to one decision, one owner, and one threshold set. Loose alerts create Slack noise. Tight alerts get acted on.
A few rules that hold up in production:
- Pricing review if smoothed price growth stays positive but days on market and price cuts worsen across two refreshes
- Supply pressure if active listings rise faster than the local baseline and new pending volume does not keep pace
- Yield review if rent trend strength weakens enough to pressure acquisition assumptions in a target zip or asset class
- Exhaustion watch if price acceleration continues after listing velocity or turnover has already rolled over
If the acquisitions team needs to rerun deal assumptions after a yield alert, the rental property calculator fits naturally into that step.
Assign owners and define the response
Alerts with no owner die in the dashboard.
A clean setup looks like this:
- Pricing lead reviews list-price guidance and concession strategy
- Marketplace or supply ops checks listing mix, quality issues, and intake pacing
- Investment analyst revisits buy-box rules, hold timing, or submarket exposure
- Data team checks refresh health, boundary mapping, and metric consistency
Pair each alert with one KPI and one action. Keep the first action small enough to test. Reprice one corridor. Pause outreach in one overheated pocket. Raise review frequency for one submarket where continuation and exhaustion are close calls.
Keep the definitions stable enough to trust
Teams lose confidence fast when thresholds drift every month. The better pattern is simple. Define what counts as softening, expansion, and slowdown before the alert fires, then log those rules in the same place the team reviews outcomes.
That matters even more in real estate because the inputs are messy. Listing status changes get delayed. Rents arrive with gaps. A metro can look healthy while one property type is already fading. Stable definitions keep analysts from rewriting the story after the chart moves.
A practical maintenance checklist:
- Validate against a second source before escalating a market-level change
- Match refresh cadence to the decision instead of polling faster than the team can act
- Store threshold versions so historical alerts can be audited later
- Review false positives and misses every few weeks
- Promote only tested logic from notebook to production workflow
The market trend analysis example that survives production is rarely the prettiest one. It is the one that handles bad joins, late feeds, and operator pushback, then still catches the difference between a healthy continuation and a trend that is running out of support.
RealtyAPI.io gives developers a unified way to pull live listings, pricing history, and market signals for this kind of workflow. If you're building dashboards, investor alerts, valuation tools, or rental analytics, visit RealtyAPI.io and test the data flow against your own market logic.