Market Price Monitoring That Works in 2026
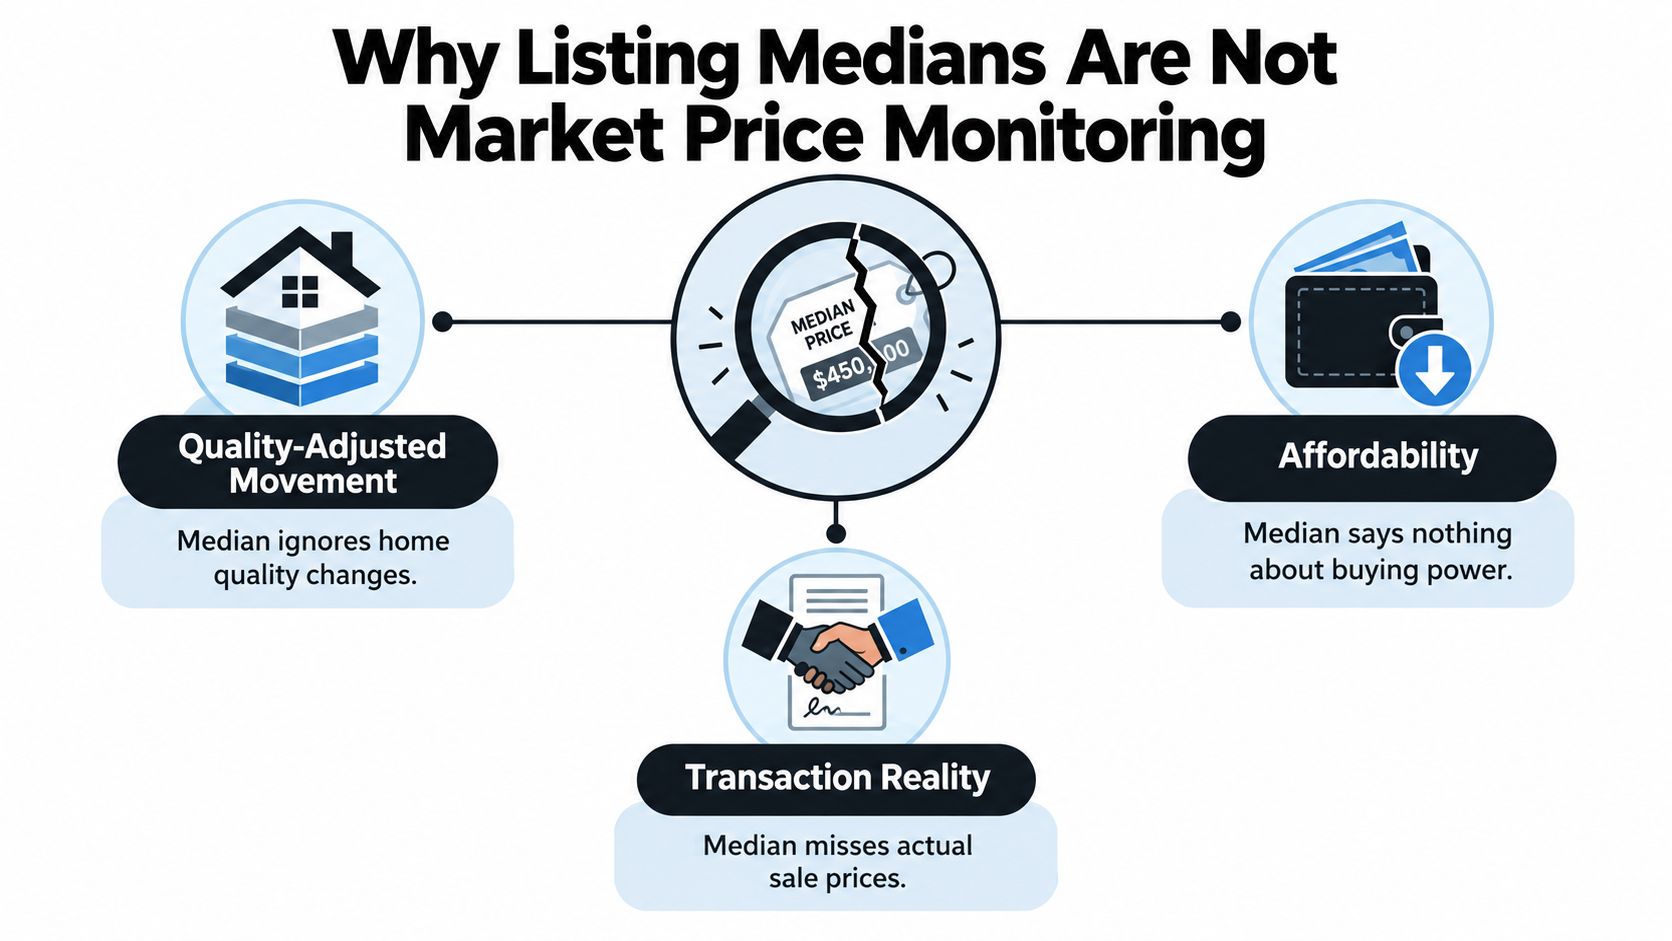
The most popular advice about market price monitoring is also the easiest to get wrong: watch listing prices and react when the median moves. A median can shift because the homes on offer changed, not because comparable properties became more or less valuable. It also says nothing about completed-sale prices or whether local households can still afford to buy.
Reliable monitoring treats price as a signal that needs context. It combines listing and transaction data, property characteristics, geography, time, and measures such as inflation and income. The result is a system for distinguishing genuine movement from changes in inventory, quality, or purchasing power.
Why Listing Medians Are Not Market Price Monitoring
A listing median can move sharply even when comparable homes hold steady. A change in the mix of homes entering the feed, such as more small units, can pull the median down without a decline in like-for-like prices. The figure describes advertised inventory, not a stable set of properties.
For PropTech teams and investment analysts, the distinction affects how alerts are interpreted. Asking prices show what sellers hope to achieve; transaction data records what buyers paid. Keeping both signals helps reveal whether advertised prices are translating into completed sales.
Build for movement, not just visibility
Market price monitoring tracks prices over time across defined locations and property segments, while accounting for shifts in property quality, inventory mix, and purchasing power. A useful system needs consistent property attributes and geographic boundaries, standardized time series, and a way to detect turning points. These choices make the signal interpretable; they also set limits on how quickly a team can update it.
Official indices demonstrate the discipline required. The Bank for International Settlements began publishing monthly residential property prices in July 2010, initially covering 37 countries. Coverage later expanded to 55 countries, including 18 G20 economies, with more than 300 series from central banks and other official sources (BIS residential property price statistics). Comparable analysis depends on consistent definitions, not a larger listing feed.
Keep asking prices as a separate signal rather than labeling them transaction values. A feed of recently sold Redfin properties can support comparisons between active listings and observed sales, as long as the pipeline preserves each record's source and price type.
A live pipeline also has to balance fast listing updates against slower official benchmarks. The practical blueprint combines meaningful metrics, a defined index method, and alerts that account for affordability as well as price movement. That gives teams a clearer basis for deciding whether a change reflects sellers' expectations, completed transactions, or pressure on buyers' purchasing power.
What Market Price Monitoring Means in Practice
Market price monitoring tracks residential prices across time, geography, and property segments, while accounting for changes in the kinds of homes being listed or sold. The goal is a set of comparable signals with clear limits, not one figure that claims to answer every market question.
Official indices offer a useful methodological reference. Historical residential price series can help analysts distinguish seasonal patterns from sustained changes or unusual breaks. For a live system, the relevant lesson is to preserve enough history and consistent definitions to compare today's signal with earlier observations, rather than treating each new feed update as a standalone market shift.
The minimum credible time series
A live pipeline need not replicate a statistical office. It should apply the same discipline to its own scope. Define stable geographic boundaries and property types, then retain observation dates and price types, such as asking prices, listing updates, contract prices, and completed sales. Normalize currency and units, and keep property attributes that support like-for-like comparisons.
These fields form a unified real estate data layer: listing and transaction records can be analyzed together without confusing seller expectations with completed-sale evidence. The trade-off is speed versus comparability. Listings update quickly, while verified transactions and official benchmarks arrive more slowly. Keep the sources distinct, and make their timing visible rather than blending them into one apparently current number.
Inflation adjustment separates changes in recorded prices from changes in purchasing power. A nominal series reports prices as observed; a real series adjusts for consumer-price inflation. If a dashboard shows only nominal movement, users may mistake broad inflation for a housing-specific change.
Scope needs equal care. A national index provides context, but may not represent a neighborhood or property segment. Label each metric with its geography and sample, and avoid presenting a narrow listing feed as a measure of the whole market. Affordability adds another practical check: compare price movement with local incomes so alerts can flag pressure on buyers even when nominal prices appear steady.
Operational rule: Preserve the raw observation alongside the normalized signal. When a source revises its data or the method changes, both are needed to explain the difference.
For builders, official methodologies are most useful as a standard for definitions, time bases, and inflation-aware comparisons. A live dashboard can use a smaller sample, provided it shows what the sample covers and keeps unlike price measures separate. That makes each alert easier to interpret and act on.
The Metrics and Signals That Matter
A monitoring alert needs a defined decision behind it. Track advertised prices for changes in current market quotes, inflation-adjusted prices for changes in purchasing power, rents alongside sale prices, and affordability relative to local incomes. These signals answer different questions, so a single metric cannot stand in for the others.
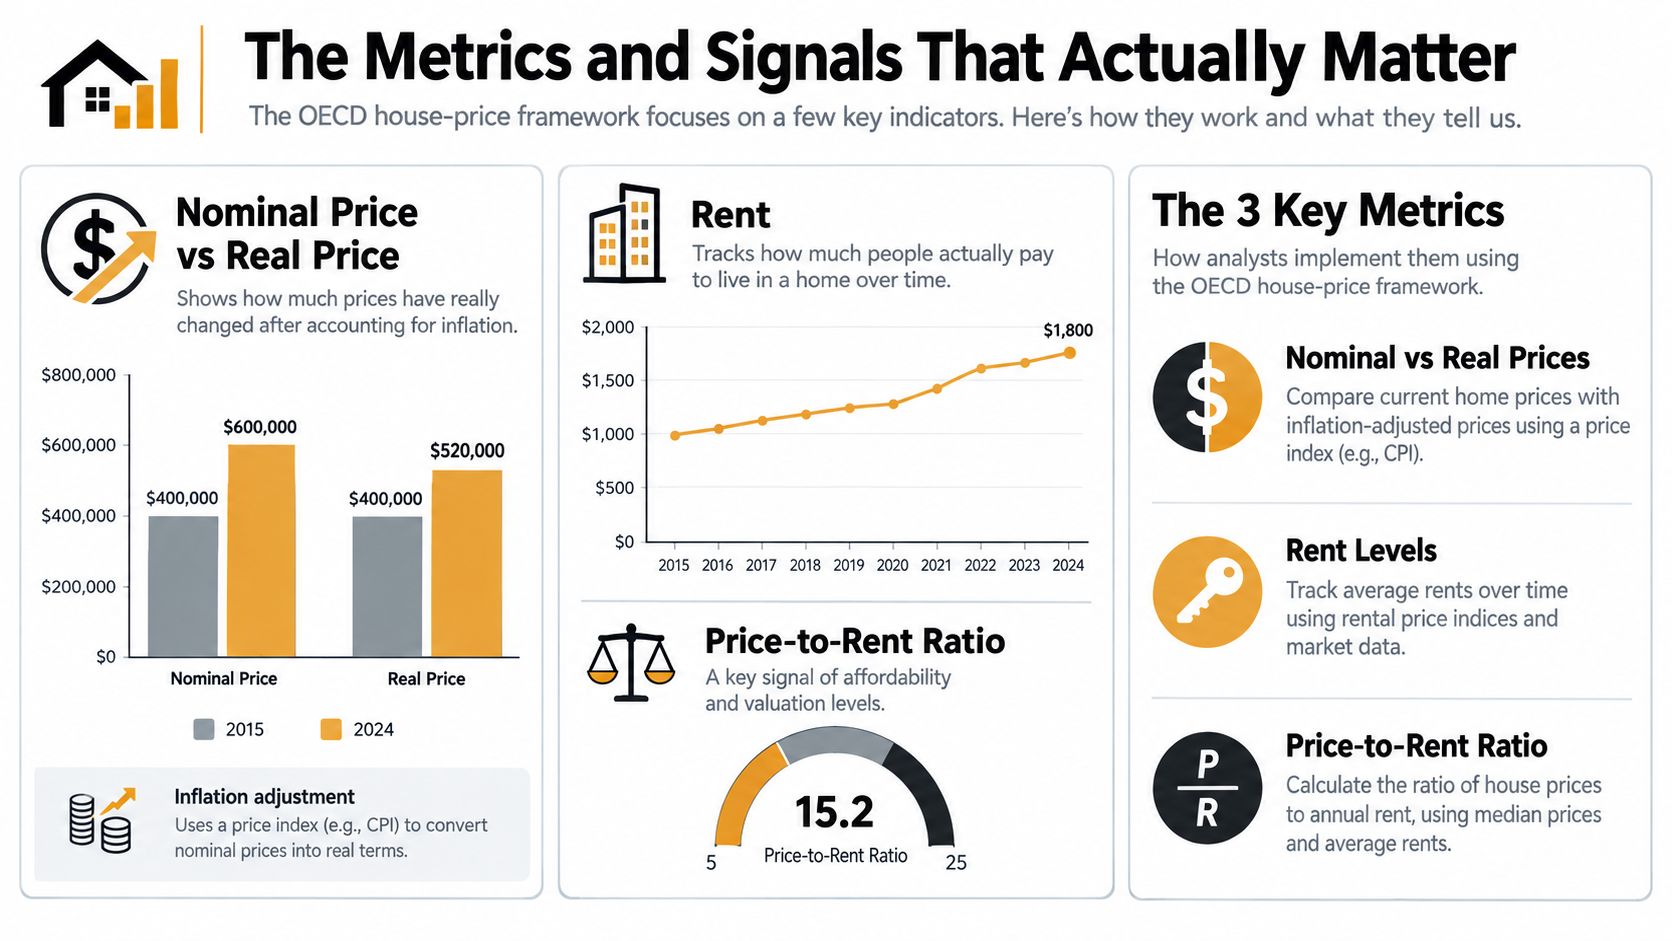
The OECD housing-price framework provides a practical set of measures: nominal house prices, real house prices, rents, price-to-rent ratios, and price-to-income ratios. It defines residential price indices around changes in market prices for properties purchased by households, generally covering new and existing dwellings where data are available. The framework also accounts for associated land, rather than treating the building alone as the asset.
Choose the indicator that matches the decision
- Nominal prices show observed movement before inflation adjustment. Use them to describe market quotes or transaction values as recorded.
- Real prices adjust the nominal price index using a consumer-expenditure deflator. They show whether housing is getting more expensive relative to general consumer prices.
- Rents and price-to-rent ratios help compare owning costs with renting costs. A changing ratio signals a shift in the relationship between sale prices and rents, but does not establish affordability by itself.
- Price-to-income ratios compare nominal house prices with nominal disposable income per person. They put price movements in a purchasing-power context and can flag deteriorating affordability even when real prices are flat.
Global figures for 2025 Q1 illustrate why dashboards need more than one lens. Nominal house prices increased 1% quarter over quarter, while real prices were broadly flat. Over the same period, the global house-price-to-income ratio rose 0.5% quarter over quarter, indicating worsening affordability despite limited real price growth (Global Housing Observatory, 2025 Q2 report). A real-price-only alert would miss that affordability signal.
Local demand measures add another view, but should remain distinct from price measures. For a city-specific example, absorption rate explained for Vancouver describes how quickly available inventory is moving. A monitoring product can pair demand indicators with historical Zillow price trends, labeling each series by source and geography so users can distinguish local listing signals from broader price trends.
Methodologies That Turn Data Into Signals
Two methods do much of the work in residential price indices: repeat-sales and hedonic models. They solve different problems. Repeat-sales compares a property with itself across transactions. Hedonic modeling estimates how attributes such as floor area, location, age, and amenities relate to price.
The FHFA House Price Index uses a geometric weighted repeat-sales procedure, aggregating transactions by month or quarter to estimate constant-quality price changes and reduce bias from changes in the mix of homes sold (FHFA HPI methodology). For a production pipeline, that means matching a property across sales with stable identifiers or carefully normalized address-and-unit keys, then measuring its price change.
Choose by data shape, then monitor the weaknesses
Repeat-sales works best when a market has enough properties that transact more than once and identifiers remain reliable. It gives a strong like-for-like comparison, but it can overrepresent homes that resell frequently and underrepresent properties with no repeat transaction. Low sample counts should be visible, not buried.
Hedonic models fit listing feeds and transaction records with rich, consistently captured characteristics. They can estimate whether comparable homes are changing in price even when the available inventory shifts. Their weakness is specification risk: omitted attributes, a poor functional form, or changing relationships between property features and price can distort the result. Teams should re-estimate models regularly, test predictions against held-out observations, and inspect residuals by geography and property type.
| Criterion | Repeat-Sales | Hedonic |
|---|---|---|
| Core comparison | The same property across transactions | Properties adjusted for observed characteristics |
| Useful data | Reliable property matching and repeat transactions | Rich attributes such as size, age, location, and amenities |
| Main risk | Thin samples and selection bias | Omitted variables and model misspecification |
| Good fit | Transaction-rich markets with stable identifiers | High-frequency listings or markets with varied inventory |
| Production practice | Show counts and mark preliminary estimates | Re-estimate, validate, and monitor residuals |
For sparse markets, pooling observations across periods can stabilize a hedonic estimate. Where attributes are incomplete but repeat transactions exist, a hybrid hedonic-repeat-sales approach can combine broader coverage with like-for-like controls. The practical decision rule is straightforward: use repeat-sales when matching and transaction depth are strong, hedonic modeling when attributes are rich, and consider a hybrid when neither source is complete enough on its own.
Data Sources, Cadence, and a Live Listings Layer
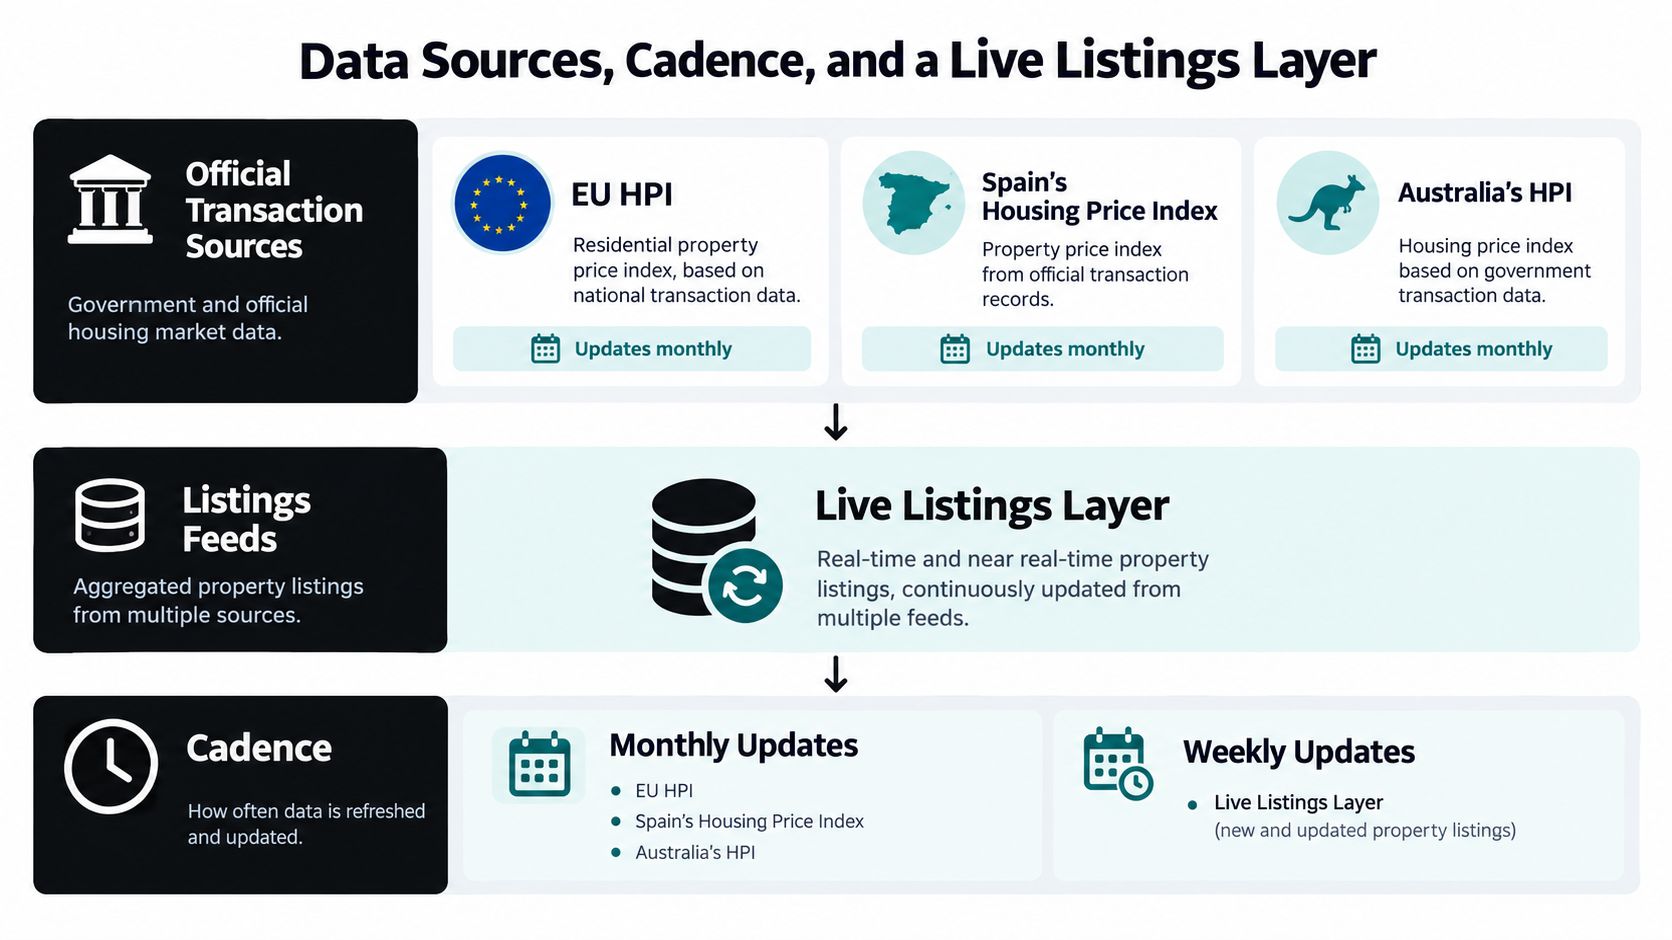
Official transaction data and live listings serve different purposes. Completed sales provide evidence of prices paid, while listings show current seller expectations and inventory. The first is slower but closer to market outcomes; the second can respond quickly but may change without a sale.
The EU House Price Index uses actual dwelling transaction prices and assigns each transaction to the quarter in which legal ownership transfers. It also captures price-determining characteristics so statisticians can account for differences in property quality (EU HPI regulation). Spain's official index excludes asking prices and appraisal values, using completed purchases and sales, then combines stratification with hedonic regression to adjust for property mix (Spain's Housing Price Index methodology).
Match cadence to the decision
Australia's capital-city residential property price indexes stratify sales by dwelling type, long-term median price, and area-level socioeconomic characteristics, then combine strata to estimate overall movement (Australian Bureau of Statistics methodology). India's Reserve Bank compiles quarterly indices for nine major cities and an all-India series using transaction prices, a weighted-average Laspeyres index, and categories based on house size and geographic ward. Its base is Q4 2008–09 = 100 (Reserve Bank of India house-price index). These approaches reinforce a practical rule: keep property type, geography, and price segment available in the monitoring layer instead of collapsing everything into one citywide average.
Cadence should follow the use case. Investor alerts may need frequent listing refreshes to surface new asking-price changes. Marketplace pricing may call for regular updates to inventory and availability. Official transaction benchmarks often arrive less frequently, so use them to validate broader direction rather than expect them to reflect today's listing conditions.
A unified layer can join those streams if it preserves provenance and observation time. A polygon-based property search by geographic area can help teams define comparable listing samples rather than pull a whole city indiscriminately. For operators who also manage rentals, Edinhart Realty and Property Management tips on rental pricing strategy offer useful context on how local operating decisions relate to rents. Keep those operational signals separate from official index measures.
Architecture and Tooling for Reliable Pipelines
A market monitoring product usually fails because the data path isn't trustworthy, not because the dashboard lacks another chart. Sources update at different times, addresses arrive in inconsistent formats, and revisions can make yesterday's signal look different today. The pipeline needs to preserve what arrived, what changed, and how the system transformed it.
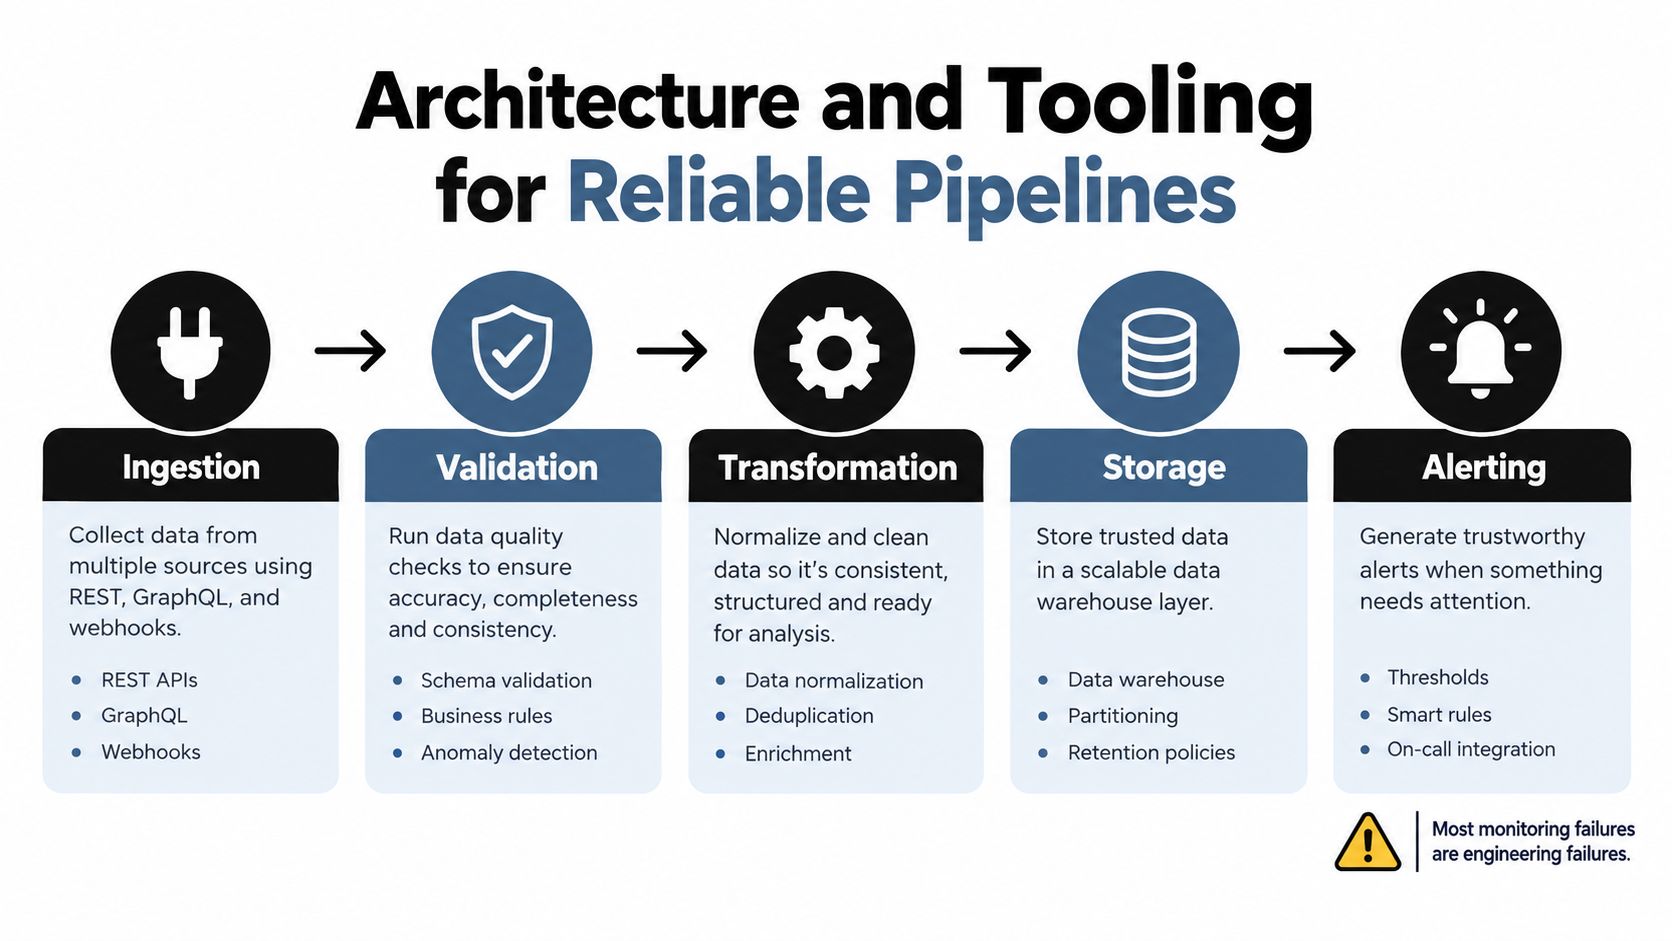
Start with ingestion. REST and GraphQL fit request-based collection, while webhooks can deliver change events when a provider supports them. Validate incoming records before they reach analytics: check required fields, plausible dates, currency, property type, and duplicate identifiers. Then normalize addresses, geographies, units, and currencies without overwriting the original values.
Keep revisions and alert logic inspectable
The storage layer should retain raw observations and versioned, normalized records. That matters because official indices can use a defined legal-transfer period, while live listings may be edited, withdrawn, or relisted. The EU's requirement to assign transactions to the quarter of ownership transfer is a reminder that the event date and the date your pipeline observed the record aren't always the same (EU HPI rules).
| Layer | What it does | Common choice |
|---|---|---|
| Ingestion | Collects source records and change events | REST, GraphQL, webhooks |
| Validation | Rejects malformed, incomplete, or duplicate records | Schema checks and quality rules |
| Transformation | Normalizes identifiers, geography, units, and currency | Batch or stream processing |
| Storage | Retains raw data, revisions, and analytical outputs | Data warehouse with time-aware history |
| Alerting | Routes actionable changes to the right team | Rules, queues, and notification services |
Retries need limits and backoff so a temporary source issue doesn't create a request storm. Idempotent writes prevent replayed records from multiplying observations. Monitoring should include pipeline health as well as market health, since a stale feed can look like a quiet market.
For a small team, a developer-first API can reduce the work of maintaining separate collection code for each source. RealtyAPI.io offers property listings and pricing signals through REST, GraphQL, and webhooks, which teams can use as a live-data layer alongside slower official benchmarks. Its rate-limit documentation helps developers design request handling around the service's operating rules.
Before shipping alerts, confirm that every metric has a definition, source, timestamp, geography, and revision status. Then test a source outage, a duplicate event, and a correction to an earlier observation. If the pipeline can't explain why an alert fired, the team can't trust it.
Alerting Strategies and Engineering Best Practices
A useful alert names a decision, not just a movement. “Prices changed” creates noise. “Comparable asking prices fell in this segment while rent burden increased” gives an analyst a reason to investigate. Build rules around the action the recipient can take, and include the sample size and data freshness so they can judge whether the signal is credible.
Affordability deserves its own alert family. Combine observed prices or rents with local income, inflation, financing costs, and property taxes where those inputs are available. Then track measures such as rent-to-income burden, mortgage-payment-to-income burden, or residual income after housing costs. A market can look stable after inflation adjustment while becoming harder to access if household incomes aren't keeping pace.
Measure the full cost, not the headline
Short-term rental monitoring has a similar blind spot: the advertised nightly rate isn't necessarily the price a traveler pays. Cleaning fees, service fees, taxes, minimum-stay rules, and currency conversion can change the total. A Congressional Research Service review notes that short-term rental fees have often appeared only during booking and that the U.S. Federal Trade Commission finalized a rule requiring upfront disclosure of total prices for short-term lodging. The review also reports that AirDNA identified 2.4 million short-term rentals generating $64 billion in annual revenue in 2023 (Congressional Research Service review).
For a meaningful comparison, preserve both the nightly rate and the all-in price for a defined stay scenario. Track each fee component separately, and don't interpret a lower advertised rate as a consumer saving if the cleaning charge rose or the minimum stay changed. This is also where a cost anomaly detection guide for engineering teams can help frame the operational question: which components changed, and does the movement merit escalation?
Make uncertainty part of the alert
Repeat-sales estimates need enough repeat transactions; hedonic estimates depend on well-captured characteristics. In either case, show transaction count, observation coverage, and whether the value is provisional. Flag thin samples, retain historical snapshots, and monitor model residuals by geography and property type. Analysts should be able to distinguish an actual turning point from a small or changing sample.
Finally, keep engineering and market analysis on one shared metric definition. Record the rule, source, refresh time, and recipient for each alert. Route data-quality failures to the pipeline owner, not the market team, and let analysts annotate legitimate exceptions. That separation stops broken feeds from being mistaken for market events while keeping the people who interpret the signal involved in improving it.
RealtyAPI.io provides a unified API for public real-estate listings, pricing trends, and live market signals that teams can combine with official benchmarks in a monitoring pipeline. Explore RealtyAPI.io to assess whether its data access and delivery options fit your product's monitoring needs.