Best Market Monitoring Tools for Real Estate in 2026
Most buyers are already shopping for a replacement. A 451 Research survey of 700 IT decision-makers found 83% were actively seeking new monitoring tools or planning to expand or improve their approach, while only 62% were satisfied with their existing platforms. That is the problem with market monitoring tools. Teams buy a logo, then discover it watches the wrong signal.
There's no single best tool here. A residential agent tracking price cuts, a CRE broker watching vacancy, a short-term rental manager chasing occupancy, and a developer building alerts don't need the same product. You're matching a platform to a signal, not buying a dashboard.
This list splits into three groups. First, paid intelligence platforms for CRE, multifamily, and short-term rentals. Second, free public dashboards from Zillow and Redfin for sanity checks and prototyping. Third, developer-facing APIs when you need monitoring inside your own product, not another tab your team forgets to open.
Pick your lane before you read. If you're pricing a single home for a client, even a home valuation for Puerto Rico sellers workflow shows why local comps matter more than national headlines. If you're underwriting a portfolio, national headlines are noise. Start with the cluster that fits your job, ignore the rest, and buy the smallest stack that covers the signal you can't afford to miss.
1. CoStar Market Analytics
Buy CoStar Market Analytics if you underwrite commercial real estate and need submarket context, not just listings. It's built for CRE investors, brokers, lenders, and owners who compare markets, submarkets, and custom property groups side by side.
The strength is combination. You get property-level research and analyst commentary next to the charts, so a rent dip comes with an explanation instead of a guess.
What It Actually Watches
- Historical performance: Rents, vacancy, and construction at market and submarket level
- Custom groups: Interactive charts for property sets you define yourself
- Forecasts: Adjustable short and medium-term outlooks you can stress test
- Analyst context: Research reports layered over the raw indicators
That forecast adjustment matters. You can model your own assumptions instead of accepting a vendor's base case, which is what separates underwriting from browsing.
Where it falls short: It's commercial only. Residential agents and rental API builders get nothing here. Pricing isn't public, so expect a demo and a sales cycle before you see a number. If you need a price today to budget a small team tool, CoStar isn't your first call.
Verdict: The default paid choice for CRE market and submarket monitoring. Skip it entirely if your world is single-family homes or short-term rentals.
2. Yardi Matrix
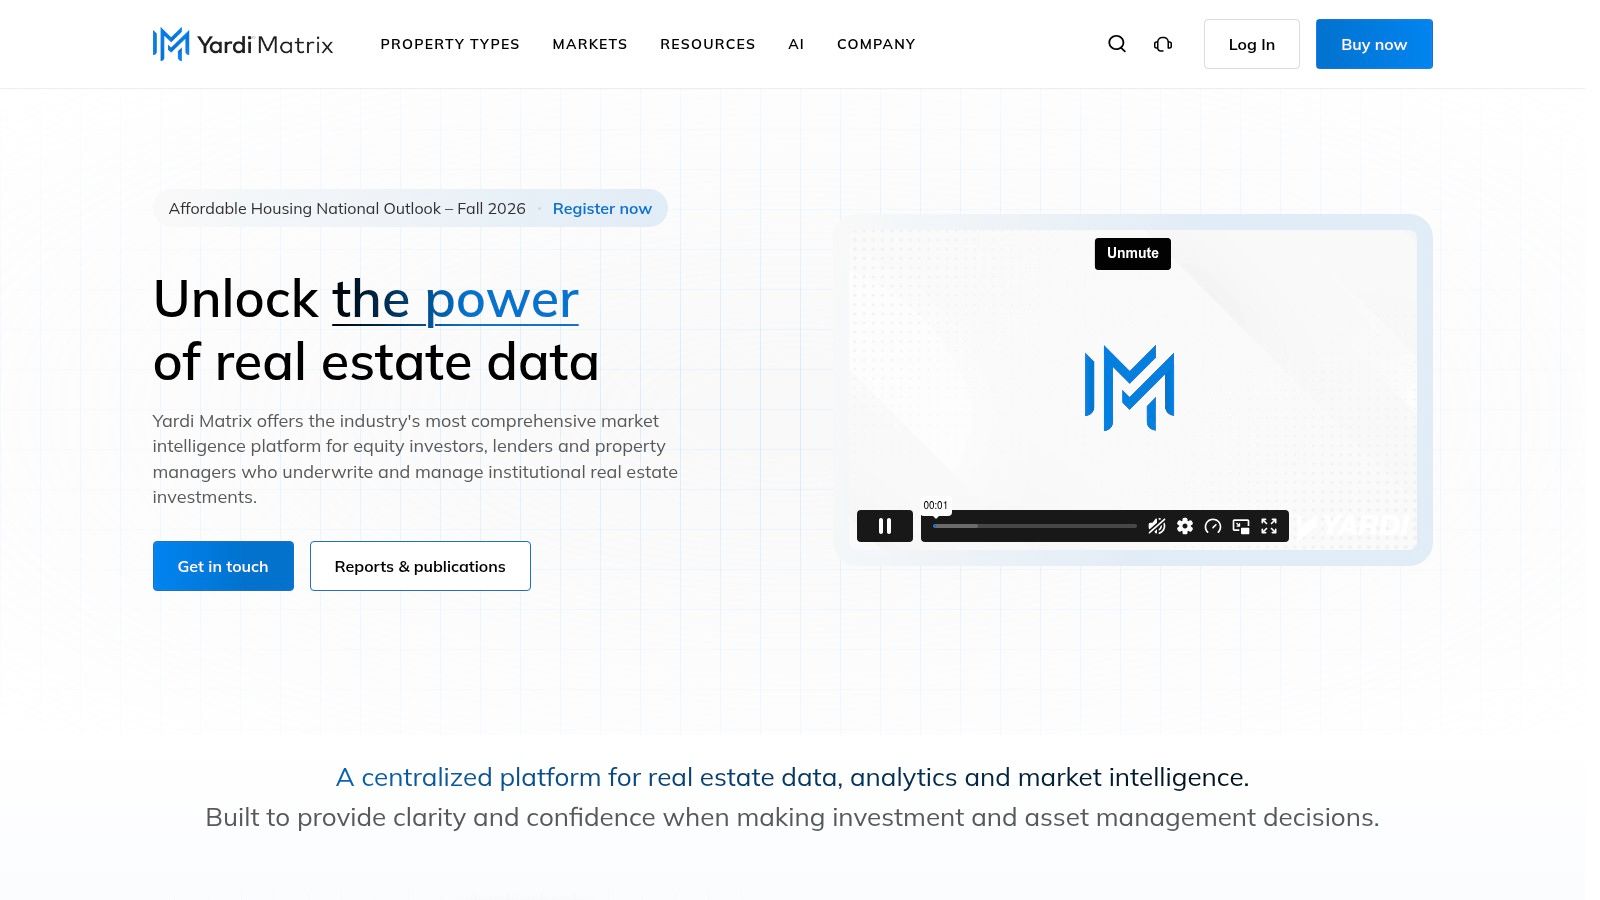
Yardi Matrix is the institutional pick when market trends alone aren't enough and you need the asset and the debt behind it. Teams underwriting, acquiring, lending against, or managing larger properties use it to connect a market story to a specific building and loan.
Coverage is broad across property types. Multifamily, affordable and student housing, single-family rentals, self-storage, office, industrial, and land all sit in one research workflow. That breadth helps if your portfolio crosses asset classes and you don't want separate vendors for each.
If you can't see loan maturity next to rent growth, you're monitoring half the risk.
The useful pairing is rents, occupancy, sales, and construction pipelines alongside ownership, management, loan balances, and maturities where available. A pipeline surge in a submarket reads differently when you can see which nearby loans mature soon.
Tradeoffs are clear. It's built for professional and institutional users, not casual research. Pricing isn't clearly published and access usually starts with sales contact. Coverage and update cadence also vary by asset type and data point, so verify your exact markets before signing.
Verdict: Choose Yardi Matrix over a pure market dashboard when financing details drive your decisions. Don't buy it for occasional neighborhood checks.
3. RealPage Market Analytics
Multifamily operators don't need another national housing chart. They need to know if concessions are creeping up on their street. RealPage Market Analytics watches that level of detail.
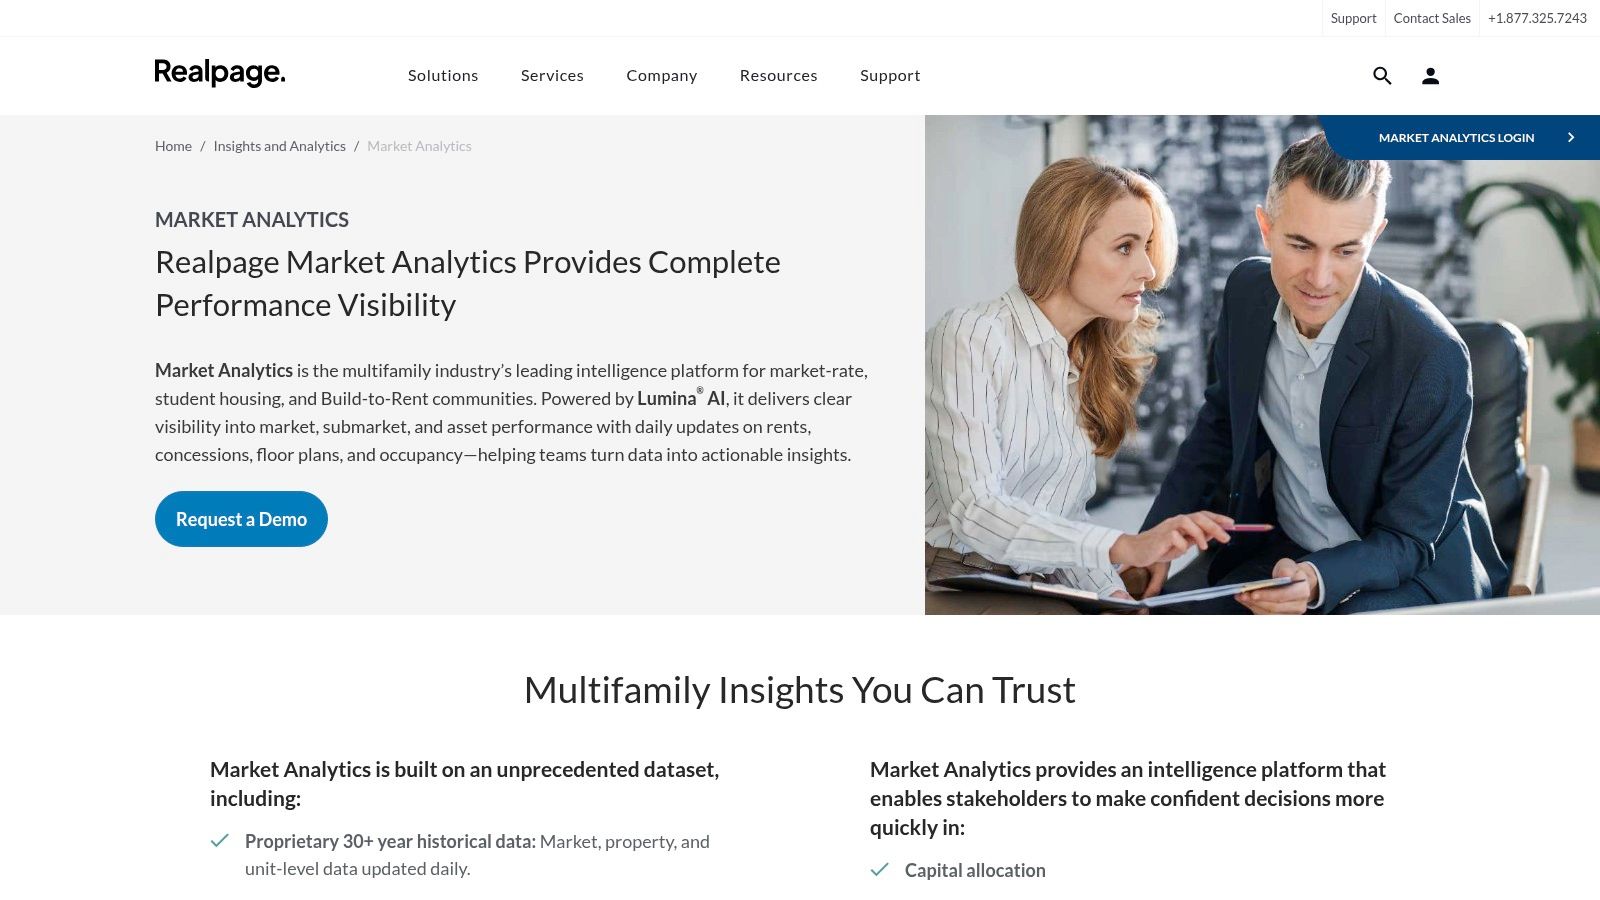
It tracks rent, occupancy, and concessions across market, submarket, and asset views, with daily updates for selected property-level information. Historical data plus five-year forecasts let owners, developers, and investors connect today's leasing softness to a longer pipeline picture.
Who Gets Value and Who Doesn't
Apartment teams get the most because market conditions link down to property and floor-plan performance. That's the difference between knowing a submarket slowed and knowing your two-bedroom units are the problem. For a lighter rental trend check outside a full platform, a rental market trends API endpoint can feed your own view without a full analytics suite.
Single-family investors and non-residential teams should look elsewhere. The focus is narrow by design. Pricing is quote-based through sales, and forecasts are modeled estimates, not guarantees. Treat any five-year line as a scenario, not a promise.
Verdict: The specialist choice for multifamily monitoring. If apartments aren't your asset, its depth is wasted on you.
4. AirDNA MarketMinder
Short-term rental revenue lives or dies on local demand, seasonality, and regulation. AirDNA MarketMinder is built only for that job, serving hosts, investors, and managers who compare vacation-rental markets and estimate property revenue.
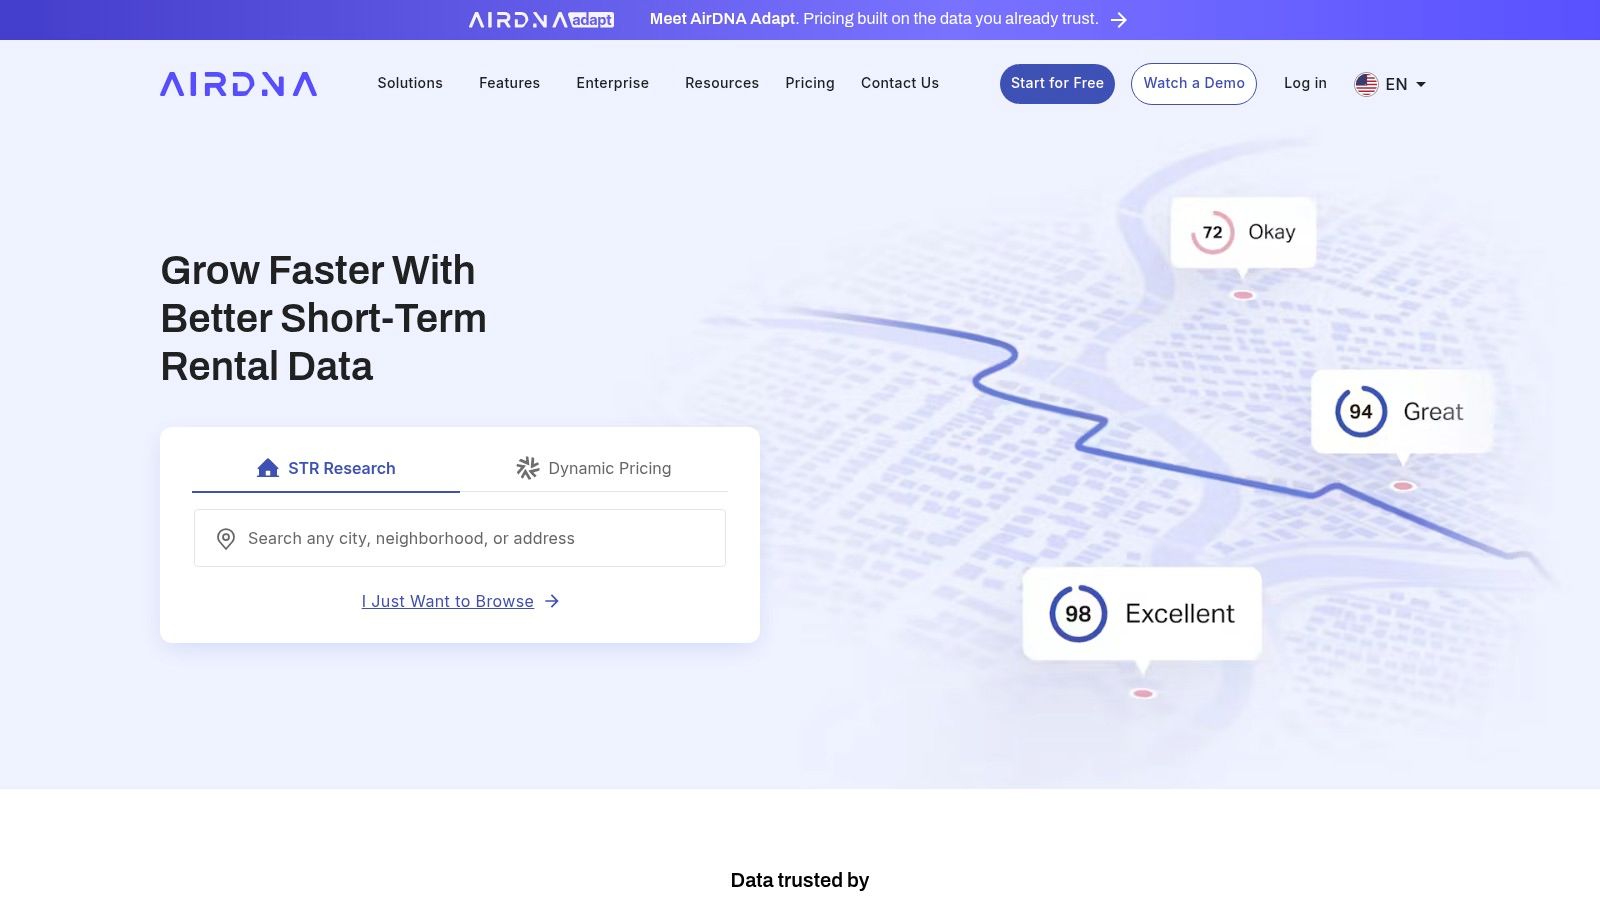
You get market and property-level insights, revenue-estimation workflows, and filters for property characteristics and amenities. AirDNA also sells separate revenue-management and enterprise data products, so a solo host and a large manager aren't forced into the same package.
Don't read a listing drop as weak demand without checking compliance. A 2026 survey of 326 operators across 46 countries found 56.4% saw no material regulatory impact in 2025, while 40.5% reported a negative impact. Enforcement hits unevenly, and your monitor won't always tell you why supply vanished.
- Best for: Comparing STR markets and screening properties before purchase
- Watch out: Modeled estimates that need validation against local rules and real calendars
- Not for: Residential sales tracking or commercial real estate
Pricing and feature access vary by subscription and product, so confirm which tier provides the markets you need.
Verdict: Buy it for short-term rental decisions only. It's the right specialist, and a poor generalist.
5. Mashvisor
Mashvisor answers the question every small investor asks first: does this property pencil better as a long-term rental or a short-term rental? It puts both income estimates, neighborhood analytics, and return calculations in one self-service platform.
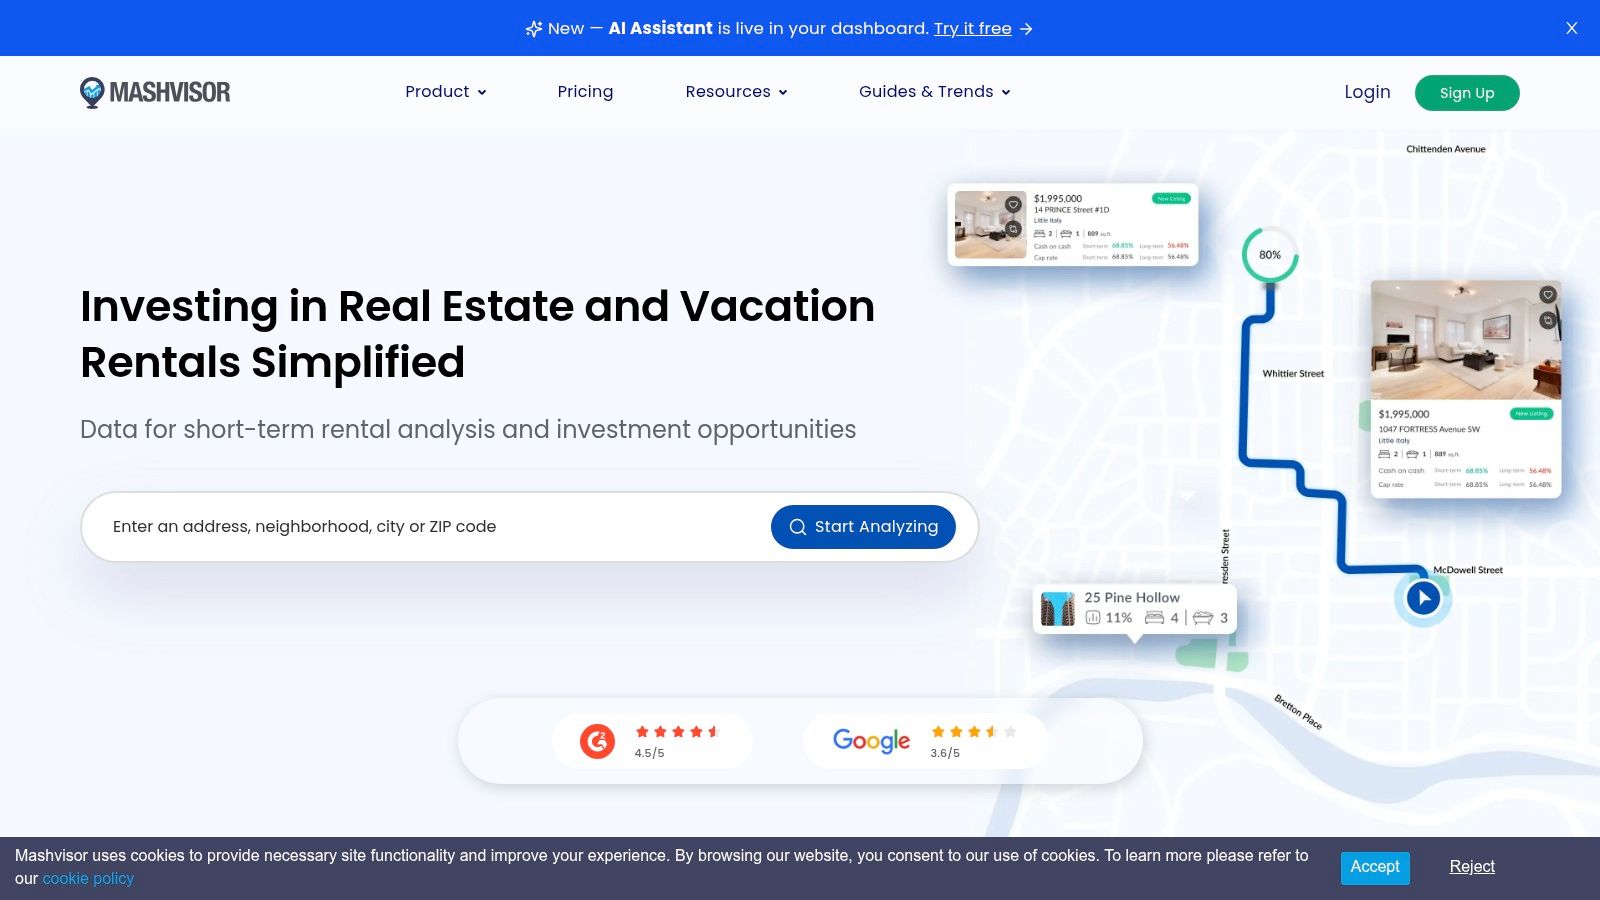
The workflow runs discovery to deal math. Market finder tools and heatmaps surface neighborhoods, then rental comps and return estimates pressure-test individual properties. The signals it watches are the ones a buy decision needs: long-term and short-term income side by side, neighborhood comps, and projected returns. Plans start at $49.99 per month when billed annually on Mashvisor's published pricing, cheap enough for a solo investor who would never sit through a CoStar sales cycle.
Mashvisor also sells a separate API for listings, trends, and rental data. If you only need a valuation signal inside your own tool, a Redfin AVM estimate API covers that narrower job, so compare the two on coverage and rate limits before paying for a full platform.
Practical rule: Use Mashvisor to rank opportunities, then verify taxes, insurance, HOA rules, and local rental law yourself before you trust the ROI number.
Limits: This is rental investment analysis, and coverage thins outside residential markets. Agents tracking listing inventory and channel managers watching live bookings will hit walls fast. API pricing and limits differ from the consumer platform, so don't assume your subscription covers integration use.
Verdict: The accessible pick for rental investors comparing strategies property by property. Buy it for acquisition screening, and look elsewhere for continuous market monitoring.
6. ATTOM Property Navigator
ATTOM Property Navigator is a property research and prospecting engine built on nationwide records. Buy it to source deals, because it will not alert you when a submarket's inventory or rents shift.
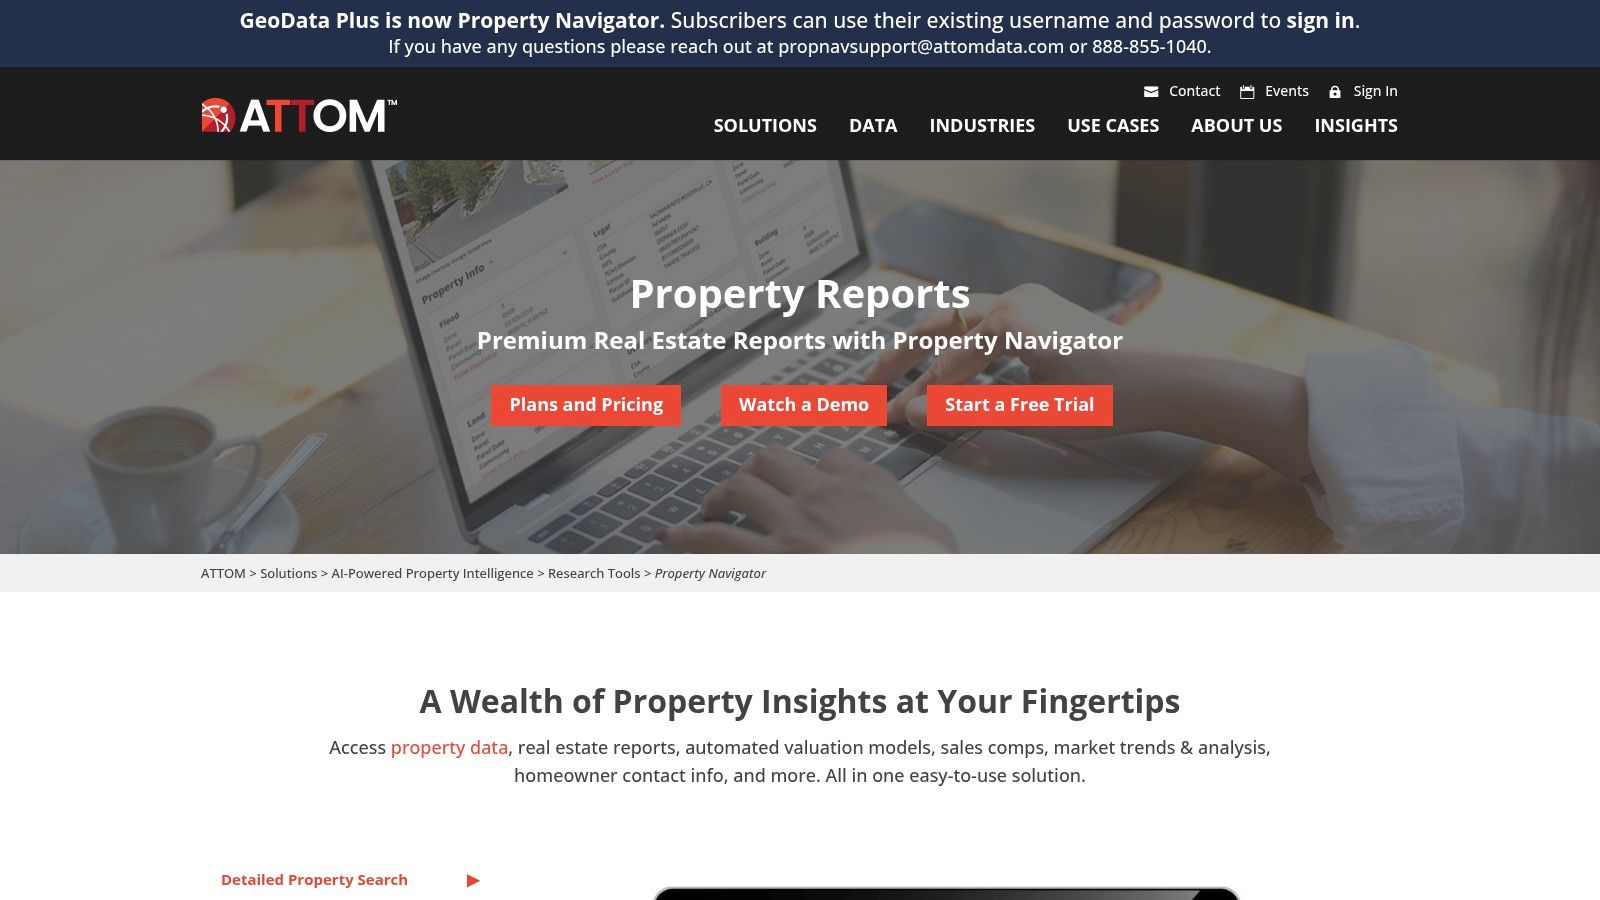
You search property records, pull reports, review comparable sales and market analysis, and check automated valuation and rental-value estimates. Filters for sales, mortgages, and distressed properties turn it into a list-building machine. An investor hunting pre-foreclosures in a county or a lender prospecting refinance candidates gets usable output in one session.
Signals It Handles Well
- Comparable sales: property-level context for pricing a specific deal
- Distress and mortgage filters: prospecting lists for investors and lenders
- Automated valuations and rent estimates: fast screening before deeper appraisal work
Investors, agents, appraisers, and lenders researching specific properties get the most from the self-service portal. The Professional plan is listed at $499 per year on the same ATTOM Property Navigator page, with customized enterprise pricing. That plan covers a single user, and data elements vary by geography, so test your target counties before committing a team.
Limits: The signals stop at property records. There are no live market alerts, no listing inventory tracking for agents, and no short-term rental demand data for channel managers. Watching a market week over week is a different job, and this tool does not do it.
Verdict: Buy ATTOM to research and prospect properties. Skip it if you need live market alerts or a shared monitoring dashboard.
7. Crexi Intelligence
Crexi Intelligence makes sense if you already source deals on Crexi. Its analytics layer lets brokers and investors explore U.S. commercial markets by property type, submarket, and timeframe while staying close to listings and transaction workflows.
That proximity is the pitch. Market context sits next to property discovery, so you can check whether a submarket supports your pricing assumptions without leaving the marketplace where you'll act on them. For a broker building a pitch, that saves real time.
But ask hard questions before you commit.
- Coverage: Which markets and property types get deep data versus thin coverage
- Exports: What you can pull out for models and client decks
- Plan inclusions: Which analytics are in your tier
Public details on pricing and detailed data coverage are limited, so you can't fully evaluate it from the website alone. That's a genuine downside compared with transparent self-service tools. Confirm everything in writing during the sales process.
It's also commercial only. Residential rental and short-term rental monitoring aren't part of the deal.
Verdict: A sensible add-on for active Crexi users in CRE. If you don't use the marketplace, CoStar or Yardi Matrix will usually give you a clearer standalone research proposition.
8. Zillow Housing Data Dashboards
Start here if your budget is zero. Zillow's housing data dashboards give you free interactive views and downloadable data on home values, inventory, sales activity, and rent trends across U.S. markets, with published methodology for key indicators.
The Market Explorer supports geographic comparisons, and downloadable datasets let analysts, journalists, and product teams run their own analysis instead of screenshotting charts. For builders who want that home value signal programmatically, a Zillow ZHVI housing market API turns a dashboard habit into a repeatable feed.
Standardization is why these free series are useful at all. Housing monitoring got more comparable when the OECD built standardized indicators where the price-to-income ratio divides the nominal house-price index by nominal disposable income per person as an affordability measure, documented in the OECD Affordable Housing Database on World Bank Data360. Asking prices alone can't tell you that story.
Limits: You get aggregate trends, not property-level monitoring. Update frequency varies by dashboard and metric, and definitions differ from other sources, so don't splice series carelessly.
Verdict: The best free sanity layer for U.S. residential trends. Pair it with a paid or API tool when money depends on the answer.
9. Redfin Data Center
Redfin Data Center is the other free workhorse, and it earns its place with trackers that go beyond headline prices. Price drops and investor purchases tell you things a median price hides.
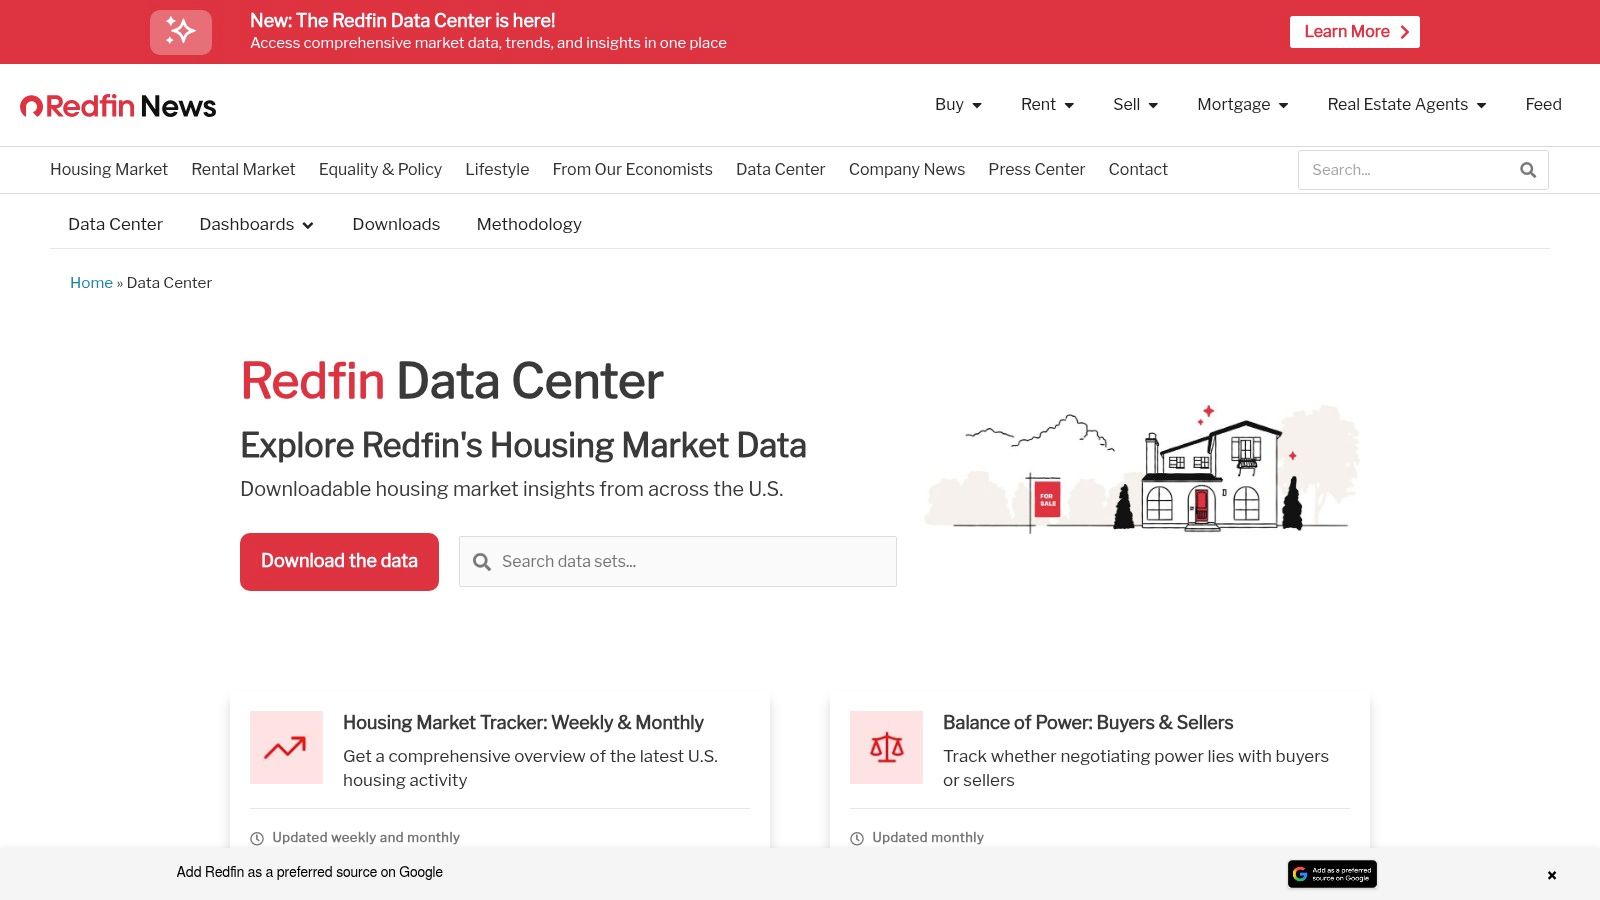
Downloads are the point. Researchers and developers can pull market trackers, compare regions, and build custom monitoring charts in their own tools. Published guidance on datasets and fields helps you avoid misreading a column. If you'd rather query than download on a schedule, a Redfin housing market trends API fits an automated workflow better.
Define your alert before you build it. A housing-price study summarized by CEPR describes a crisis indicator as a cumulative fall of at least 5% in house prices, with a possible one-year exception. That's a usable dashboard rule. A vague "market weakening" flag isn't.
Limits: There's no real alerting or property-management product here. Coverage depends on the dataset, and reporting periods need care when you compare against Zillow or local MLS data.
Verdict: Ideal for lightweight analysis and prototypes. You'll outgrow it when you need alerts, not files.
10. RentCast
RentCast is the pick when your monitoring plan starts with code, not dashboards. It watches U.S. rental signals directly: property records, active rental listings, rent estimates, comps, and market data through self-service tools plus a REST API.
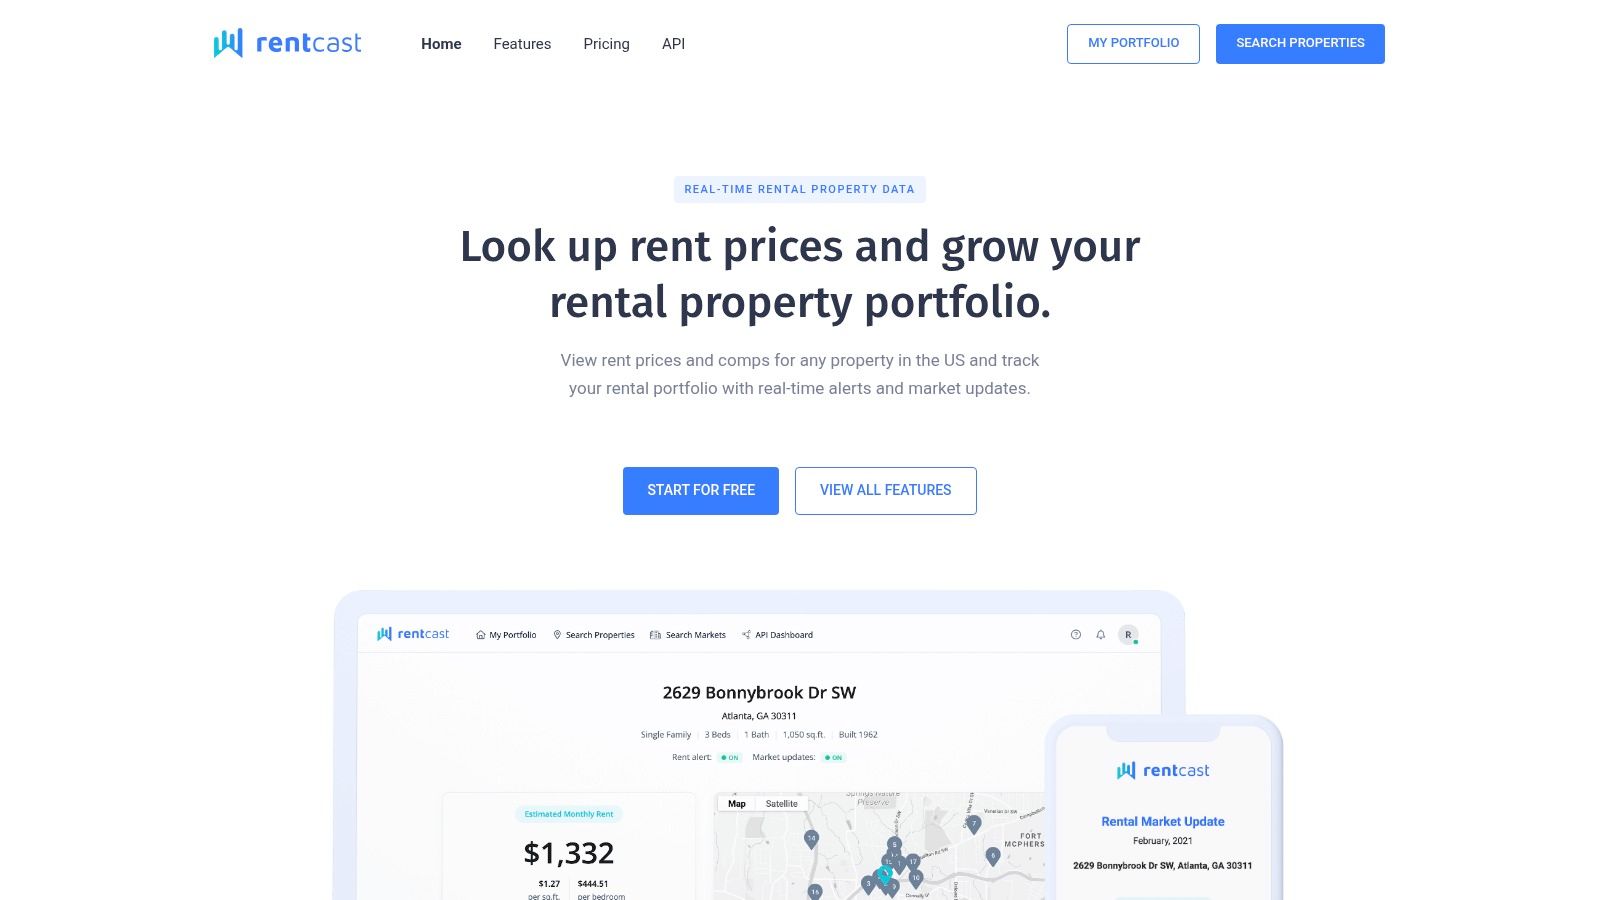
The useful split is simple. Product users get ZIP-level rental market insights, historical rent trends, and property alerts. Developers get request-based API pricing without a long-term contract, and the free Developer tier includes up to 50 requests per month per RentCast's published API offering. That is enough to test a rent monitor before budget enters the conversation.
Check These Constraints First
- Geography: U.S. only, so global products need another source
- Usage costs: Request limits can trigger overage fees, and its billing documentation does not set a hard usage cap, so throttle jobs on your side
- Scope: Strong for long-term rental signals, weak for CRE workflows and short-term rental analytics
That missing hard cap is the operational risk. A retry loop can turn into an invoice before anyone looks at the dashboard.
Verdict: Use it for U.S. rental comps and prototype alerts. Skip it if one integration must cover multiple countries, sales inventory, or STR demand.
Top 10 Market Monitoring Tools: Feature Comparison
| Platform | Focus & Coverage | Core Strengths | Best-Fit Audience | Pricing / Access | Standout |
|---|---|---|---|---|---|
| CoStar Market Analytics | Commercial markets and submarkets | Historical trends, forecasts, property research, analyst commentary ★ | 👥 CRE investors, brokers, lenders, owners | 💰 Quote-based; contact sales | 🏆 Analytics paired with analyst context |
| Yardi Matrix | Multifamily and other institutional property types | Ownership, rents, occupancy, construction, and debt research ★ | 👥 Institutional investors, lenders, operators | 💰 Contact sales | ✨ Combines property, market, and financing intelligence |
| RealPage Market Analytics | Multifamily markets and properties | Rent, occupancy, concessions, historical trends, five-year forecasts ★ | 👥 Apartment owners, developers, investors, operators | 💰 Quote-based | ✨ Granular multifamily and floor-plan analysis |
| AirDNA MarketMinder | Short-term rentals | Market comparisons, property insights, revenue estimates ★ | 👥 Hosts, vacation-rental investors, managers | 💰 Subscription pricing varies | 🏆 Vacation-rental-specific market research |
| Mashvisor | U.S. rental investment properties | Rental estimates, neighborhood analytics, ROI analysis ★ | 👥 Rental investors and property researchers | 💰 Plans from $49.99/month billed annually; separate API | ✨ Compares long- and short-term rental strategies |
| ATTOM Property Navigator | U.S. residential and commercial properties | Records, comps, valuations, rental values, distressed-property searches ★ | 👥 Investors, agents, appraisers, lenders | 💰 Professional plan listed at $499/year; enterprise pricing customized | 🏆 Detailed property-level research |
| Crexi Intelligence | U.S. commercial real estate markets | Market and submarket analysis by property type and timeframe ★ | 👥 CRE brokers and investors | 💰 Pricing and plan details limited | ✨ Links analytics with property discovery |
| Zillow Housing Data Dashboards | U.S. residential housing markets | Home values, inventory, sales, rent trends, downloadable data ★ | 👥 Analysts, developers, journalists, product teams | 💰 Free | 🏆 Accessible aggregate data and published methodology |
| Redfin Data Center | U.S. housing markets | Downloadable price, inventory, price-drop, and investor activity data ★ | 👥 Researchers and developers | 💰 Free | ✨ Trackers support custom charts and analysis |
| RentCast | U.S. rental properties and markets | Listings, rent estimates, comps, trends, alerts, REST API ★ | 👥 Rental-focused developers and property users | 💰 Free Developer tier up to 50 requests/month; paid plans available | ✨ Combines rental tools with API access |
Build Your Stack Around the Signal, Not the Logo
Don't buy ten tools. Buy three layers, and only if you need all three.
Layer one is one paid intelligence platform for the asset class you underwrite. CRE teams pick CoStar, Yardi Matrix, or Crexi Intelligence. Multifamily operators pick RealPage. Short-term rental managers pick AirDNA, and rental investors who self-serve pick Mashvisor. Paying for two platforms in the same asset class usually means you're paying twice for overlapping charts while your real gap, alerting or property-level data, stays unfilled.
Layer two is one free public dataset as a sanity check. Zillow dashboards or Redfin Data Center downloads keep a vendor honest. When your paid platform says a market turned, a free standardized series tells you whether the turn shows up elsewhere or lives only in one vendor's model. This habit also protects you outside the U.S., where the same discipline helps buyers avoid overpaying for Israel real estate by testing a seller's story against independent market evidence.
Layer three is an API, but only if monitoring must happen inside your product or workflow. Dashboards don't send alerts, feed pricing engines, or update investor reports on their own. If your team checks a portal manually every morning, you don't have monitoring. You have a habit.
Alert quality decides whether layer three works. Industry architecture guidance cited by DataField notes well-calibrated surveillance platforms can still generate false-positive rates of 90–95% or higher, detailed in DataField's market surveillance architecture chapter. Real estate tools face the same fatigue problem. Demand deduplication, configurable thresholds, rolling baselines, and explainable alerts for signals like sudden price changes, inventory acceleration, repeated delistings, and divergence between comparable neighborhoods. Measure precision by alert type and time from source change to notification, not raw alert volume.
Data representativeness matters as much as speed. Eurostat's 2026 project processed roughly 30 million usable offers covering about 6.7 million distinct properties across 13 EU countries, yet still reported representation varied by country, as described in Eurostat's residential real estate indices methodology. Ask every vendor how many unique properties are represented, how duplicates and relistings are handled, and whether you're seeing asking prices or completed transactions. A smaller deduplicated sample with clear provenance beats a bigger biased feed.
For teams building that API layer across sources, RealtyAPI.io aggregates listings and trends from Redfin, Realtor, Airbnb, Zoopla, Bayut, Apartments.com, and Idealista behind a single endpoint with REST, GraphQL, and webhooks. That lets you skip wiring up separate scrapers for each portal and focus on thresholds, baselines, and what your users do when an alert fires.
Choose the smallest stack that covers the signal you cannot afford to miss.
RealtyAPI.io gives your team normalized listings, pricing trends, and live market signals from major portals through one REST and GraphQL API with webhooks, so you can build alerts and dashboards without maintaining a pile of scrapers. Start testing your first market monitoring workflow today at RealtyAPI.io.