8 Market Indicators Today: What Each Number Tells You

The IMF October 2026 World Economic Outlook projects global economic growth of 3.1% in 2026, followed by an acceleration to 3.4% in 2027. That's the backdrop for housing. Growth is positive, but it's running below the pace recorded in 2024 to 2025, and the IMF flags financial market repricing and renewed conflict as downside risks. In other words, the macro environment isn't collapsing, yet it isn't giving property markets a strong tailwind either.
That tension is why you shouldn't read any single housing number on its own. Listings can rise while closings stay weak. Prices can edge up while payment affordability gets worse. Rent growth can look healthy while new supply is about to loosen the market underneath it.
This briefing covers eight market indicators today that matter most for real estate and investment decisions. Each one is paired with a decision it informs, whether that's when to buy, how to price, whether to hold, or whether to re-rent at a higher rate. Each one also gets a pairing indicator, because confirmation matters more than a headline.
Read them as a system. Rates set the cost of acting, sales show whether anyone is acting, and inventory, prices, construction, and rents show what happens next. Together, they tell you whether a move is a regime change or just noise.
1. 30-Year Fixed Mortgage Rate
7.33%. The Realtor.com October 2026 data put the average US 30-year mortgage rate at that level, 107 basis points higher than one year earlier. The 30-year fixed mortgage rate is the borrowing cost most US buyers face. Freddie Mac publishes it weekly in the Primary Mortgage Market Survey, and it moves mainly with the 10-year Treasury yield plus investor expectations for inflation and Federal Reserve policy. A rise of that size hits the monthly payment before it changes the asking price.

A buyer who qualified comfortably a year ago can sit near the edge of qualification after that increase. Same house, different payment. Analysts watch the reverse as well. Rate declines often show up in mortgage purchase applications reported by the Mortgage Bankers Association, usually after a short lag. Turning the rate into a monthly payment on a median-priced home runs the same test.
The Decision It Informs
When to buy or refinance is the decision this print informs. Pair the weekly rate with purchase applications. Rates that fall while applications stay flat point to prices, credit, or confidence still binding buyers, not financing cost alone. When the rate and applications move together, demand is thawing. California Loans for Heroes mortgage insights is a single lender's page and is not a substitute for the weekly survey.
- Track the spread: Watch the gap to the 10-year Treasury to separate broad market moves from lender pricing.
- Timestamp every print: Store revisions so historical comparisons stay clean in models.
- Model the payment: Run scenarios in a mortgage calculator before you treat a rate dip as a buy signal.
2. Existing Home Sales
Existing home sales count previously owned homes that closed in a month, reported on an annualized basis by the National Association of Realtors monthly. That's why analysts trust it. It doesn't measure tours, clicks, or intentions. It measures completed transactions at current prices and current rates.
The AEI Housing Market Indicators for October 2026 showed housing inventory up 2.7% year over year and only 3.4% below September 2019, yet September existing-home sales were 28.9% below that same pre-pandemic benchmark. Read that divergence carefully. Supply is normalizing faster than liquidity is returning, which means more choice for buyers without a real recovery in deal volume.
The Decision It Informs
Whether to hold, list now, or wait is the practical question. A brokerage watching weak closings might hold back agent hiring and shift marketing spend toward listings that can transact. An investor comparing sales volume against inventory gets a cleaner read on price direction than either series gives alone.
Pair existing sales with pending home sales. Pending contracts lead closings by a month or two, so a pending rebound that never shows up in closed sales points to fall-throughs, appraisal gaps, or financing failures. A closed-sales rebound confirmed by pendings is more durable.
You can pull national trends programmatically through US housing market trends data, but check revision status before any automated report goes out. Compare each month with the same month a year earlier to strip out seasonality, and don't annualize a single soft month into a thesis.
Closed sales tell you what the market cleared, not what it wanted. Always ask what price and rate it cleared at.
3. Median Existing Home Sale Price
The median existing home sale price is the midpoint of homes sold in a period. Half sold for more, half for less. Because it uses the middle rather than the average, a handful of luxury closings can't drag it around the way they can a mean. That's its strength. Its weakness is mix. If more large homes sell in one month, the median rises even if no individual home gained value.
The Redfin US housing market data put the September 2026 median home price at $393,895, up 1.3% from a year earlier, with 1,510,784 homes listed for sale, an annual increase of 1.7%. Modest price growth alongside expanding listings doesn't read as scarcity-driven appreciation. It reads as a market holding nominal prices while supply slowly loosens.
A pricing illustration shows the trap here.
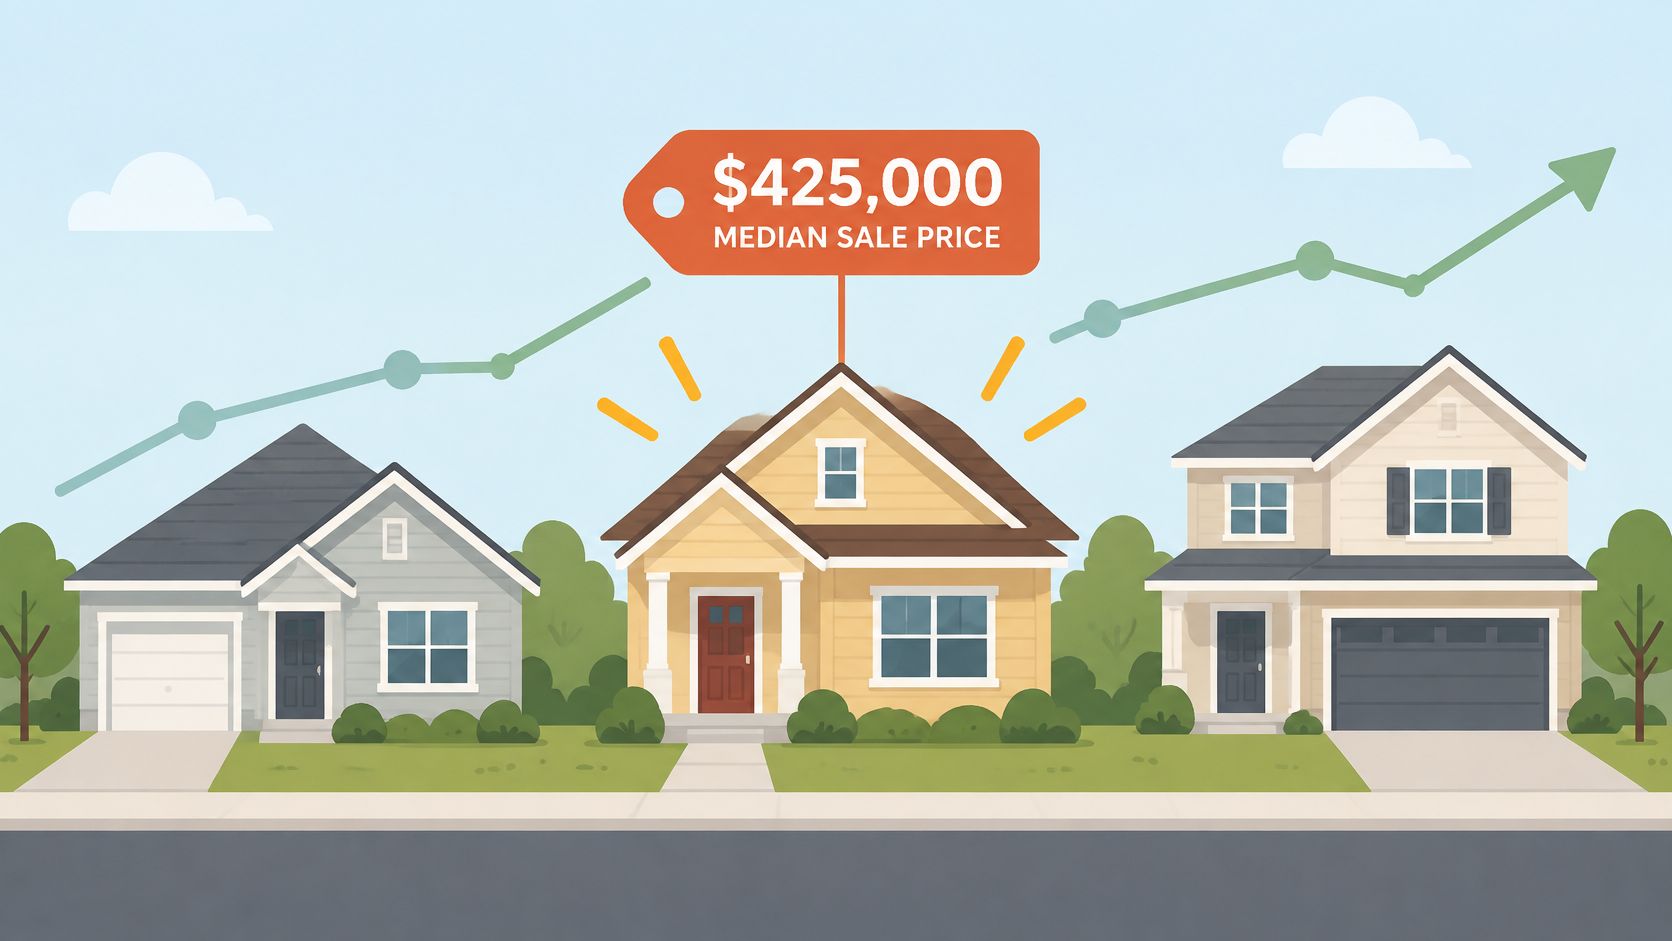
Say a metro reports a higher median while entry-level sales stall. That metro isn't appreciating across the board. Higher-end homes are making up a bigger share of a thinner market. Local reports use year-over-year median changes to describe appreciation or cooling, and pricing models use ZIP-level medians as valuation benchmarks, but both uses need the mix check first.
The Decision It Informs
How to price a listing or an offer is the call. Compare medians within the same property type and size band, use year-over-year changes over month-to-month swings, and cross-check against a repeat-sales index for a like-for-like view.
4. Months Supply of Inventory
Months supply of inventory estimates how long it would take to sell everything currently listed at the current sales pace. You calculate it by dividing active listings by monthly sales. It's the cleanest single measure of balance because it forces supply and demand into one ratio instead of letting you admire one and ignore the other.
Low months supply means sellers hold pricing power and prices face upward pressure. High months supply means buyers can negotiate, wait, and demand concessions. The movement matters as much as the level. A market drifting steadily toward buyer-favorable territory changes underwriting even before prices visibly fall.
The video below explains how practitioners read that balance in practice.
Consider an investor screening metros for a new acquisition. In one metro, listings climb but sales hold steady, so months supply rises slowly. In another, listings barely move but sales drop sharply, so months supply jumps. The second market is riskier, because demand, not supply, is doing the damage. Months supply alone won't tell you which case you're in. New listings will.
The Decision It Informs
Whether to buy now or wait for a better opportunity is the call, and the pairing indicator is new listings. Rising supply from fresh listings in a growing metro can be healthy. Rising supply from collapsing sales is a warning.
- Segment it: Track months supply by metro and price tier, since national averages hide sharp local splits.
- Smooth it: Use a rolling three-month average in thin markets where one month distorts the ratio.
5. Median Days on Market
Speed is information. Median days on market measures how long listed homes take to go under contract or sell, reported as the median across listings in a period. Short times signal competition and thin choice. Long times signal buyers comparing options, requesting repairs, and walking away from overpriced listings without much cost.
Because platforms can publish it weekly or monthly, it moves faster than closed-sales data. That makes it useful for near-term monitoring, client alerts, and catching a turn while monthly reports still describe last month's market.
This timeline shows the journey that the median compresses into a single number.
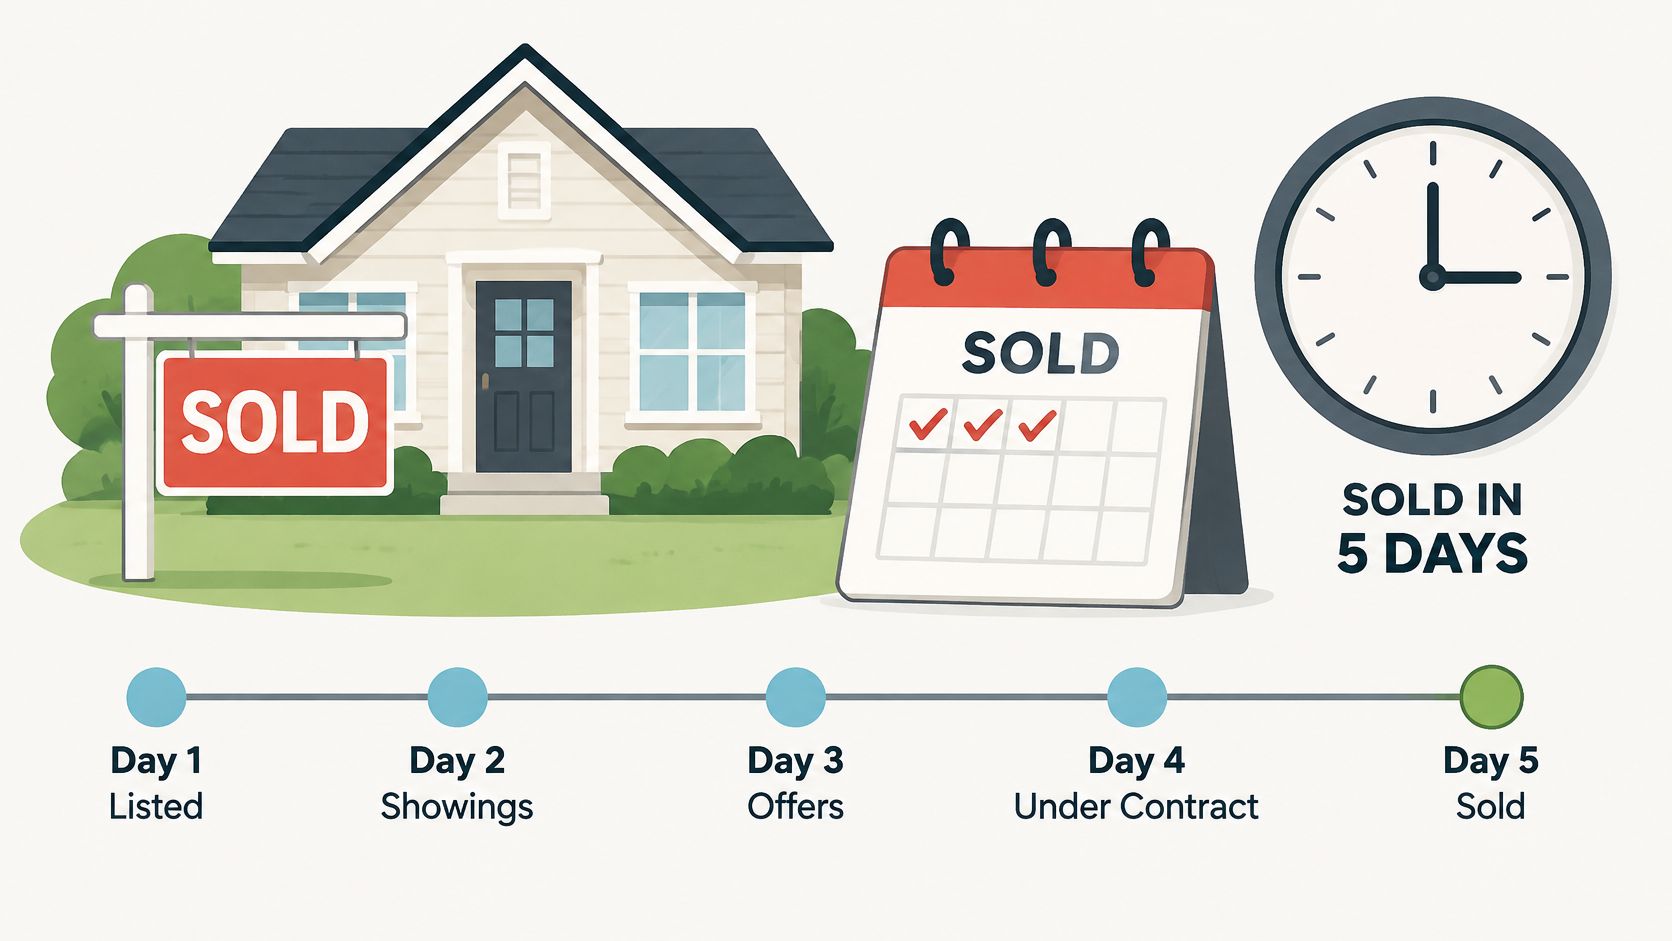
Say two neighborhoods sit in the same metro with similar prices. In one, median days on market drops sharply quarter after quarter. In the other, it stretches. Listing platforms flag the first as a hot-market area, and sellers' agents use that trend to defend firmer pricing. In the second, the right advice is usually a sharper launch price rather than a slow sequence of cuts.
The Decision It Informs
How aggressively to price and how fast to act is the call. Pair days on market with the share of listings taking price reductions. Long marketing times plus rising reductions confirm sellers are chasing the market down. Long times with few reductions suggest stale, unrealistic asking prices rather than weak underlying demand.
Compare against the same period in prior years to handle seasonality, segment by price tier, and use market hotness data to spot where speed is changing first.
6. Housing Starts and Building Permits
Building permits count authorized future construction. Housing starts count projects that have begun. The US Census Bureau publishes both monthly, usually a few weeks after the reference month. Permits lead, starts confirm. Together they show whether builders expect demand to support new inventory in coming quarters, and how much of that expectation is already becoming real supply.
Neither series is smooth. Weather, permitting backlogs, and large multifamily projects make single months jump around. Use three-month or twelve-month averages, and always split single-family from multifamily. A surge in apartment permits and a surge in detached-home permits have different buyers, different financing, and different effects on your market.
The construction pipeline those permits feed looks like this.

Say a rental analyst sees multifamily permits climbing in a metro where vacancy is already rising. That combination argues for flat or falling effective rents ahead, whatever current asking rents say. Homebuilder equity analysts run the mirror image, using single-family permit trends to gauge volume outlooks and land demand.
The Decision It Informs
Whether to buy ahead of new supply or wait for it is the call. Compare permits with starts to size the pipeline not yet begun. A wide gap means authorized supply could still be delayed or abandoned if financing tightens. Permits converting quickly into starts mean the supply is coming whether today's prices like it or not.
Practical rule: Treat permits as intent and starts as commitment. Underwrite to the commitment, scenario-test the intent.
7. S&P Cotality Case-Shiller Home Price Index
The S&P Cotality Case-Shiller Home Price Index tracks single-family prices using a repeat-sales method. It compares what the same property sold for at different times, which controls for size, quality, and location differences across transactions. That makes it a more like-for-like measure of appreciation than a median, which mixes genuine price change with shifts in what's selling.
It's published monthly for the US national index and major metros, and investors, lenders, and policymakers use it to assess valuation risk. The tradeoff is timeliness. Repeat-sales methods need closed, matched transactions, so the index describes the market with a lag. You're getting precision about the recent past, not a live feed of this week.
Say a mortgage-backed securities investor is reviewing collateral in a loan pool. Median prices in the pool's metros look flat, but that's partly because smaller homes dominate recent sales. Metro Case-Shiller indices show like-for-like prices still declining. The collateral view changes, and so does the loss assumption. Valuation platforms use the same indices to adjust automated estimates over time between observed sales.
The Decision It Informs
Whether appreciation is real enough to underwrite is the call. Pair Case-Shiller with the median sale price. If both rise together, appreciation is broad. If the median rises while Case-Shiller is flat, mix is doing the work, and you shouldn't capitalize that increase into a valuation.
Use year-over-year changes to cut monthly noise. Compare metro indices with the national composite, because regional divergence is often the story the national number buries.
8. Rental Vacancy Rate and Rent Growth
Rents across 30 tracked global cities rose 2.2% during 2025, Savills global cities research found, while Los Angeles, Hong Kong, and Cape Town each recorded growth of at least 10%. A city print and a global average answer different questions.
The rental vacancy rate is the share of rental units vacant and available for rent. The US Census Bureau publishes it quarterly through the Housing Vacancy Survey. Rent growth tracks asking or effective rents over time. Low vacancy with rising rents implies tight conditions. Rising vacancy with flat rents implies demand is softening, whatever landlords post as the asking rent.
Quality is the caveat that averages hide. Chronic undersupply can push rents up in a weak market, and a shift in which units are listed can flatter the mean. Occupancy, absorption, concessions, and new listings have to sit beside the rent figure before you treat the print as strength.
Affordability can hold rental demand up while for-sale demand stalls. The UBS Global Real Estate Bubble Index release notes annual ownership costs for a newly purchased 60-square-metre home exceed 40% of a highly skilled worker's gross income in many major cities. When owning costs that much more than renting, tenants have less reason to leave.
Whether to re-rent higher, offer concessions, or hold is the call, the same rent-versus-concessions math an investor runs before they buy a vacation rental property in Destin. Pair vacancy with the permit pipeline. Multifamily analysts use rental market trends data to see where new supply can bend rents next. Compare asking rents with effective rents. Asking rent rising while concessions widen is a higher sticker with a wider discount.
How the Eight Market Indicators Compare
Eight series map to four calls: buy, price, hold, or re-rent. Use one series for the call and a second to confirm or contradict it.
| Item | Update Frequency | Primary Source | Best Use |
|---|---|---|---|
| 30-Year Fixed Mortgage Rate | Weekly | Freddie Mac | Track borrowing costs and buyer affordability |
| Existing Home Sales | Monthly | National Association of Realtors | Measure completed home transactions and demand |
| Median Existing Home Sale Price | Monthly | National Association of Realtors, Redfin, and Zillow | Track sale-price levels and market trends |
| Months Supply of Inventory | Monthly | National Association of Realtors and Realtor.com | Assess housing supply-demand balance |
| Median Days on Market | Weekly or monthly | Redfin, Realtor.com, and Zillow | Monitor how quickly homes are selling |
| Housing Starts and Building Permits | Monthly | US Census Bureau | Gauge construction activity and future housing supply |
| S&P Cotality Case-Shiller Home Price Index | Monthly | S&P Dow Jones Indices | Analyze like-for-like home price trends |
| Rental Vacancy Rate and Rent Growth | Quarterly vacancy; monthly or quarterly rent growth | US Census Bureau and private rent-index providers | Assess rental supply, demand, and rent trends |
Months supply is active listings divided by that month's sales, so the figure moves with the monthly sales release. Vacancy stays on a quarterly clock. Rent growth from private indexes arrives monthly or quarterly. Do not blend those cadences into one "latest" number.
A lower weekly mortgage rate means buying got cheaper on financing. Monthly existing-home sales say whether buyers closed. Cheaper rates with flat sales are an affordability gain that demand has not confirmed.
Set an asking price from the median sale price, then check Case-Shiller. The median is the level at which homes cleared. Case-Shiller is the like-for-like change. If only the median moves, the mix of homes sold changed.
Hold the ask when months supply and days on market both stay tight. Looser months and longer days support a cut or a longer hold. Re-rent higher only if permits and vacancy do not both point to excess supply. More permits with low vacancy means new building into still-tight occupancy. More permits with high vacancy means supply is already loose.
Turning Today's Market Indicators Into Decisions
No single indicator tells the whole story, and the recent cross-market data shows why. The IMF chapter in the October 2026 outlook projects global headline inflation at 4.7% for 2026 before easing to 4.1% in 2027, above the rate estimated for 2025. Stalled disinflation keeps rate cuts delayed, borrowing costs high, and every housing indicator above under financing pressure. Read housing against that backdrop, not against a hope that cheap money returns on schedule.
Financial markets can mislead you the same way. The Saxo market quick take for November 10, 2026 recorded the S&P 500 up 2.4% to 7,549.94 and the VIX down 22% to 19.92, while the ten-year Treasury yield traded near 4.88%. Equities and volatility improved, financing costs didn't. That's a relief rally, not an easing of conditions. Property signals split the same way, with listings recovering while closings lag, so confirmation across paired indicators is the whole discipline.
Build a short routine and stick to it. Check mortgage rates weekly because they move first and reset affordability immediately. Check sales, inventory, months supply, and days on market monthly, because that's the cadence at which real balance changes. Check Case-Shiller and vacancy quarterly in your deeper reviews, since they confirm trend rather than trigger action. Solid real estate market research techniques mostly come down to that sequencing, reading fast indicators for timing and slow ones for truth.
Verify every figure against its original publisher before it reaches a client report or investment memo. Series get revised, seasonal factors get recalculated, and a number that was right last month may not be the number of record today. That caution applies to aggregated feeds too.
If you want these series tracked automatically, RealtyAPI.io's Watchlist can alert you to changes in property listings on an hourly, daily, or custom schedule, emailing the before and after values when something moves. One API covers property, rental, and market data across 27 listing platforms, including Redfin, Realtor, Airbnb, Rightmove, Zoopla, and Idealista. Every data point comes from publicly available sources, and RealtyAPI.io does not guarantee accuracy, completeness, or timeliness, so confirm the numbers for your own use case before you act on them.
Build your market monitoring on live listing, pricing, and rental signals instead of stale monthly summaries, with one API covering property and market data across dozens of platforms. Set Watchlist alerts on the listings and markets you care about, and get the before and after values by email when prices or status change. Get started at RealtyAPI.io and pull your first market indicators into a dashboard today.